Teiko launches antigen density assays for clinical trials
A new custom panel cytometry service that quantifies the absolute number of target molecules per cell, so drug developers can compare antigen levels across markers. See how the antigen levels compare between patient groups, disease, and immune cell populations.
Teiko now supports antigen density assays as part of its custom mass cytometry panel development service: Teiko builds a custom panel from its 33- or 41-marker mass cytometry backbone, performs bead calibration, generates standard calibration curves, and delivers results on an AI-integrated cytometry dashboard for fast insights.
What's new
Customers choose the markers they want quantified, and Teiko's scientists take it from there, from building a custom panel to generating a bead-based standard curve that converts signal intensity to absolute counts.
Results are delivered on a dedicated "antigen density" tab on the TokuProfile Dashboard, with three visualization types:
- Box-and-whisker plots for group comparisons
- Heatmaps to scan populations and subjects in a single view
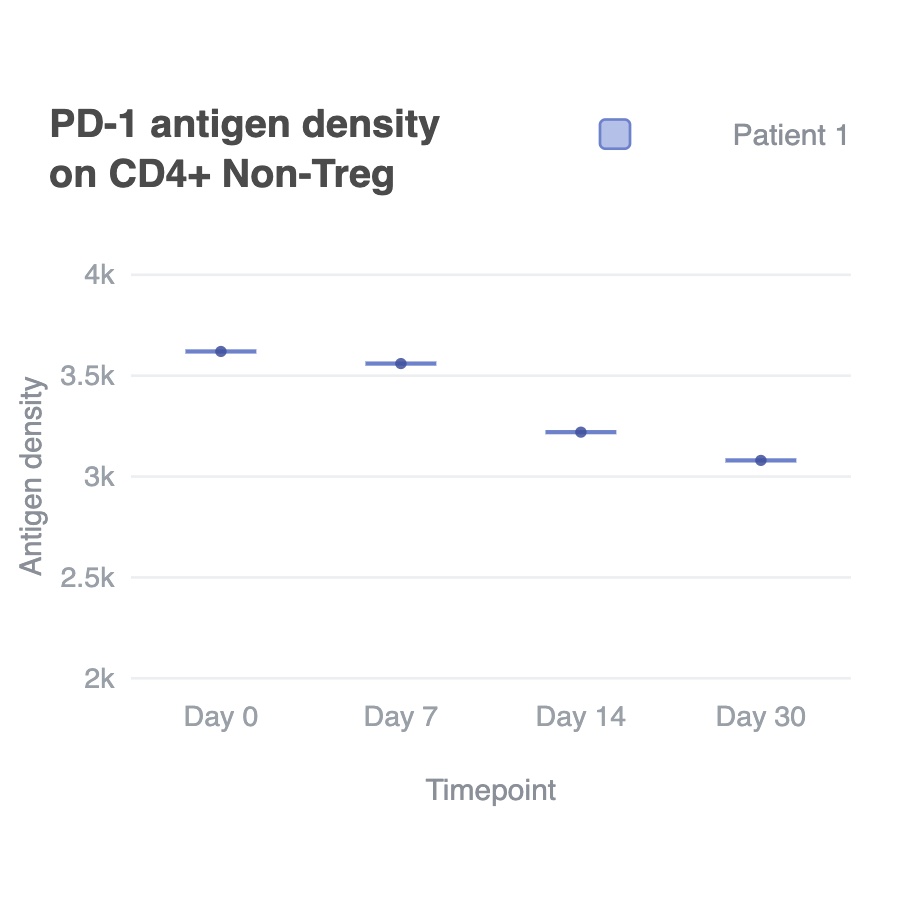
- Line graphs to track patients over time
For the full background on what antigen density is, why it matters, and how Teiko measures it, read What Is Antigen Density, Anyway? →
See antigen density in action on Dashboard
Wondering how this is visualized on the TokuProfile Dashboard? The Dashboard enables you to use patient metadata to dynamically compare antigen density between disease type, individual subjects, and collection timepoints.
The plot below displays PD-1 antigen density in T cells across disease groups, revealling how target levels compare between conditions
.png)
The same metric can also follow a single patient over time. Below, one patient's PD-1 density is tracked across four treatment timepoints, potentially indicating that antigen escape is emerging as density falls.
Why it matters
Here are three ways teams put antigen density quantification to work for their clinical trials:
- Optimize patient stratification — relative cell frequencies can mask why some patients respond, and others don't; density sets precise baseline target thresholds to screen in the right patients.
- Diagnose antigen escape — immune cells can lose the antigen a drug targets over time, and resistance follows; antigen density shows when it drops below the level a drug needs to work.
- Define a safety window — antigen density helps define how much of a target is on different cell populations, informing a safety window before dosing patients.
Availability
Antigen density assays are available now as part of Teiko's custom mass cytometry panel development service, adding 1 to 10 custom markers to Teiko's 33- or 41-marker backbone panel.
Ready to see it in your data?
Start a project or visit teiko-labs.com/antigen-density to learn more.