Quantify antigen density on any target marker.
For your clinical trial, Teiko builds a custom panel from our 33- or 41-marker mass cytometry backbone, performs bead calibration, generates standard curves, and delivers results your team can act on.
The process
Select target markers
Choose the targets you want to measure.
Generate bead standard curve
Use beads to produce a standard curve that converts signal into antibodies bound per cell for your test samples.
View your results
View your antigen counts across cell populations and subsets on our AI-integrated cytometry dashboard.
From selecting target markers to quantified antigen density.
You choose the markers, our scientists take it from there.
Select markers for your custom panel
Choose the target markers you want to measure and snap into our backbone.
Learn about panel development →Calibrate with Quantum Simply Cellular (QSC) beads
Stain a series of 5 Quantum Simply Cellular bead populations with known antibody-binding capacity.
Generate the standard curve
Measure the signal intensity of each bead population and fit to a standard curve.
Quantify on your samples
Run samples on the full panel; map each marker's signal intensity onto the curve to convert signal into antigen density.
Visualize counts on the dashboard
Explore antigen density across markers, populations, and disease groups. All interactive and shareable.
How the curve translates signal into density.
Each calibration bead carries a known number of antibody-binding sites. By measuring the signal intensity of all five bead populations, we build a curve that maps raw signal to a quantified number of molecules per cell.
CD19 antigen density
AD = 100.9999x − 600.000 · R² = 0.9989
Representative standard curve.
See antigen density with your data.
A dedicated antigen density tab reports target molecules per cell for every profiled immune population. Display results by endpoint or group, and filter by cohort, cell type, endpoint, and group.
Compare PD-1 antigen density across disease groups
See how density differs between patient cohorts, with every sample shown as a point.
.png)
Track PD-1 antigen escape over time
One patient, followed across treatment timepoints, with every measurement shown as a point.
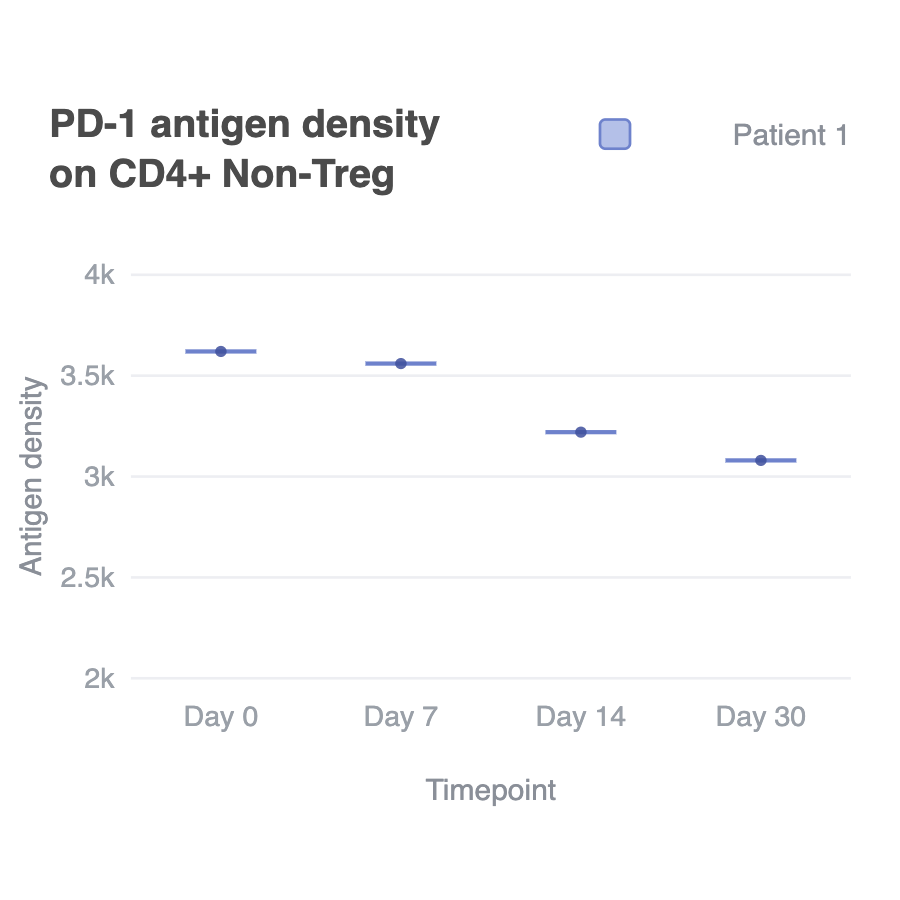
Antigen density reported as antibodies bound per cell. Representative data for illustration.
Explore the dashboard →Antigen density informs clinical decisions.
Antigen density supports many translational questions. Here are three ways teams put it to work.
Optimize patient stratification
Relative cell frequencies can mask why some patients respond and others don't. Density sets precise baseline target thresholds to screen in the right patients.
Diagnose antigen escape
Immune cells can lose the antigen your drug targets, and resistance follows. Antigen density shows when it drops below the level your drug needs to work, so teams can adjust the combination or timing.
Define your safety window
Before dosing patients, antigen density help define how much of your target population is on different cell populations. This analysis can help you define a safety window.
Frequently asked
BasicsWhy not just use signal intensity?›
Relative signal intensity depends on the metal a marker is conjugated to, so two targets can read as comparable when their true expression differs widely. Antigen density normalizes every marker to the number of molecules per cell, giving an apples-to-apples comparison across your panel. For the full background, read our explainer: What is antigen density anyway? →
MethodHow is antigen density calculated, and in what units?›
We run a series of calibration beads with a known number of antibody-binding sites, measure the signal of each, and fit a standard curve. Each marker's signal on your samples is mapped onto that curve and reported as antibodies bound per cell.
PlatformWhat platform is the assay run on?›
Antigen density is quantified by mass cytometry, with your custom panel built on our 33- or 41-marker backbone. Running quantification within a deep immune panel means you get density in the context of the full immune landscape, not as a standalone readout.
PanelHow many custom markers can I add?›
You can add 1–10 custom markers to your panel. To see the standard markers and how customization works, explore our custom mass cytometry panels →
SamplesWhat sample types can I use?›
Antigen density panels run on both cryopreserved PBMCs and whole blood. Whole blood can be processed directly from TokuKit-fixed samples, so clinical sites fix at the time of collection without central-lab PBMC isolation.
Ready to quantify antigen density on your targets?
Share the markers and sample type you're working with, and our scientists will help design the right custom panel with you.