Custom spectral cytometry panels
Start with our validated 25-marker spectral backbone, then add, swap, or fully customize based on your study needs.
A customized spectral panel lets you
- Detect target-specific markers
- Understand mechanism of action
- Support dose selection
- Measure drug pharmacodynamics
The 25-marker backbone is built on what works
- Published research
- Real-world feedback from academic and pharma teams
- Expert review by cytometry KOLs
- Years of hands-on panel development experience
Populations the backbone profiles
Every panel starts with the 25-marker backbone, with the option to build from the ground up.
Lymphoid cells
Myeloid cells
Choose your panel configuration
Add one marker
Add one study-specific marker to our validated 25-marker spectral backbone.
Swap one marker
Replace one marker in our 25-marker spectral backbone with a study-specific marker.
Fully custom panel
Design a fully custom spectral panel tailored to your biology and program.
Custom panels built for
Human blood, PBMCs, and bone marrow/BMMCs
We build panels for human blood, peripheral blood mononuclear cells, and bone marrow with markers tailored to your biology.
Sample stability testing
We design panels for TokuKit-preserved blood and evaluate stability across multiple timepoints, confirming that subset frequencies and marker expression stay consistent after collection.
25-marker backbone panel
Marker list, gating strategy, functional markers, and sample gating plots. Mean intra- and inter-run CVs under 5%.
25 records: marker, clone, the populations it defines, and whether it quantifies a functional state.
.svg)
.png)
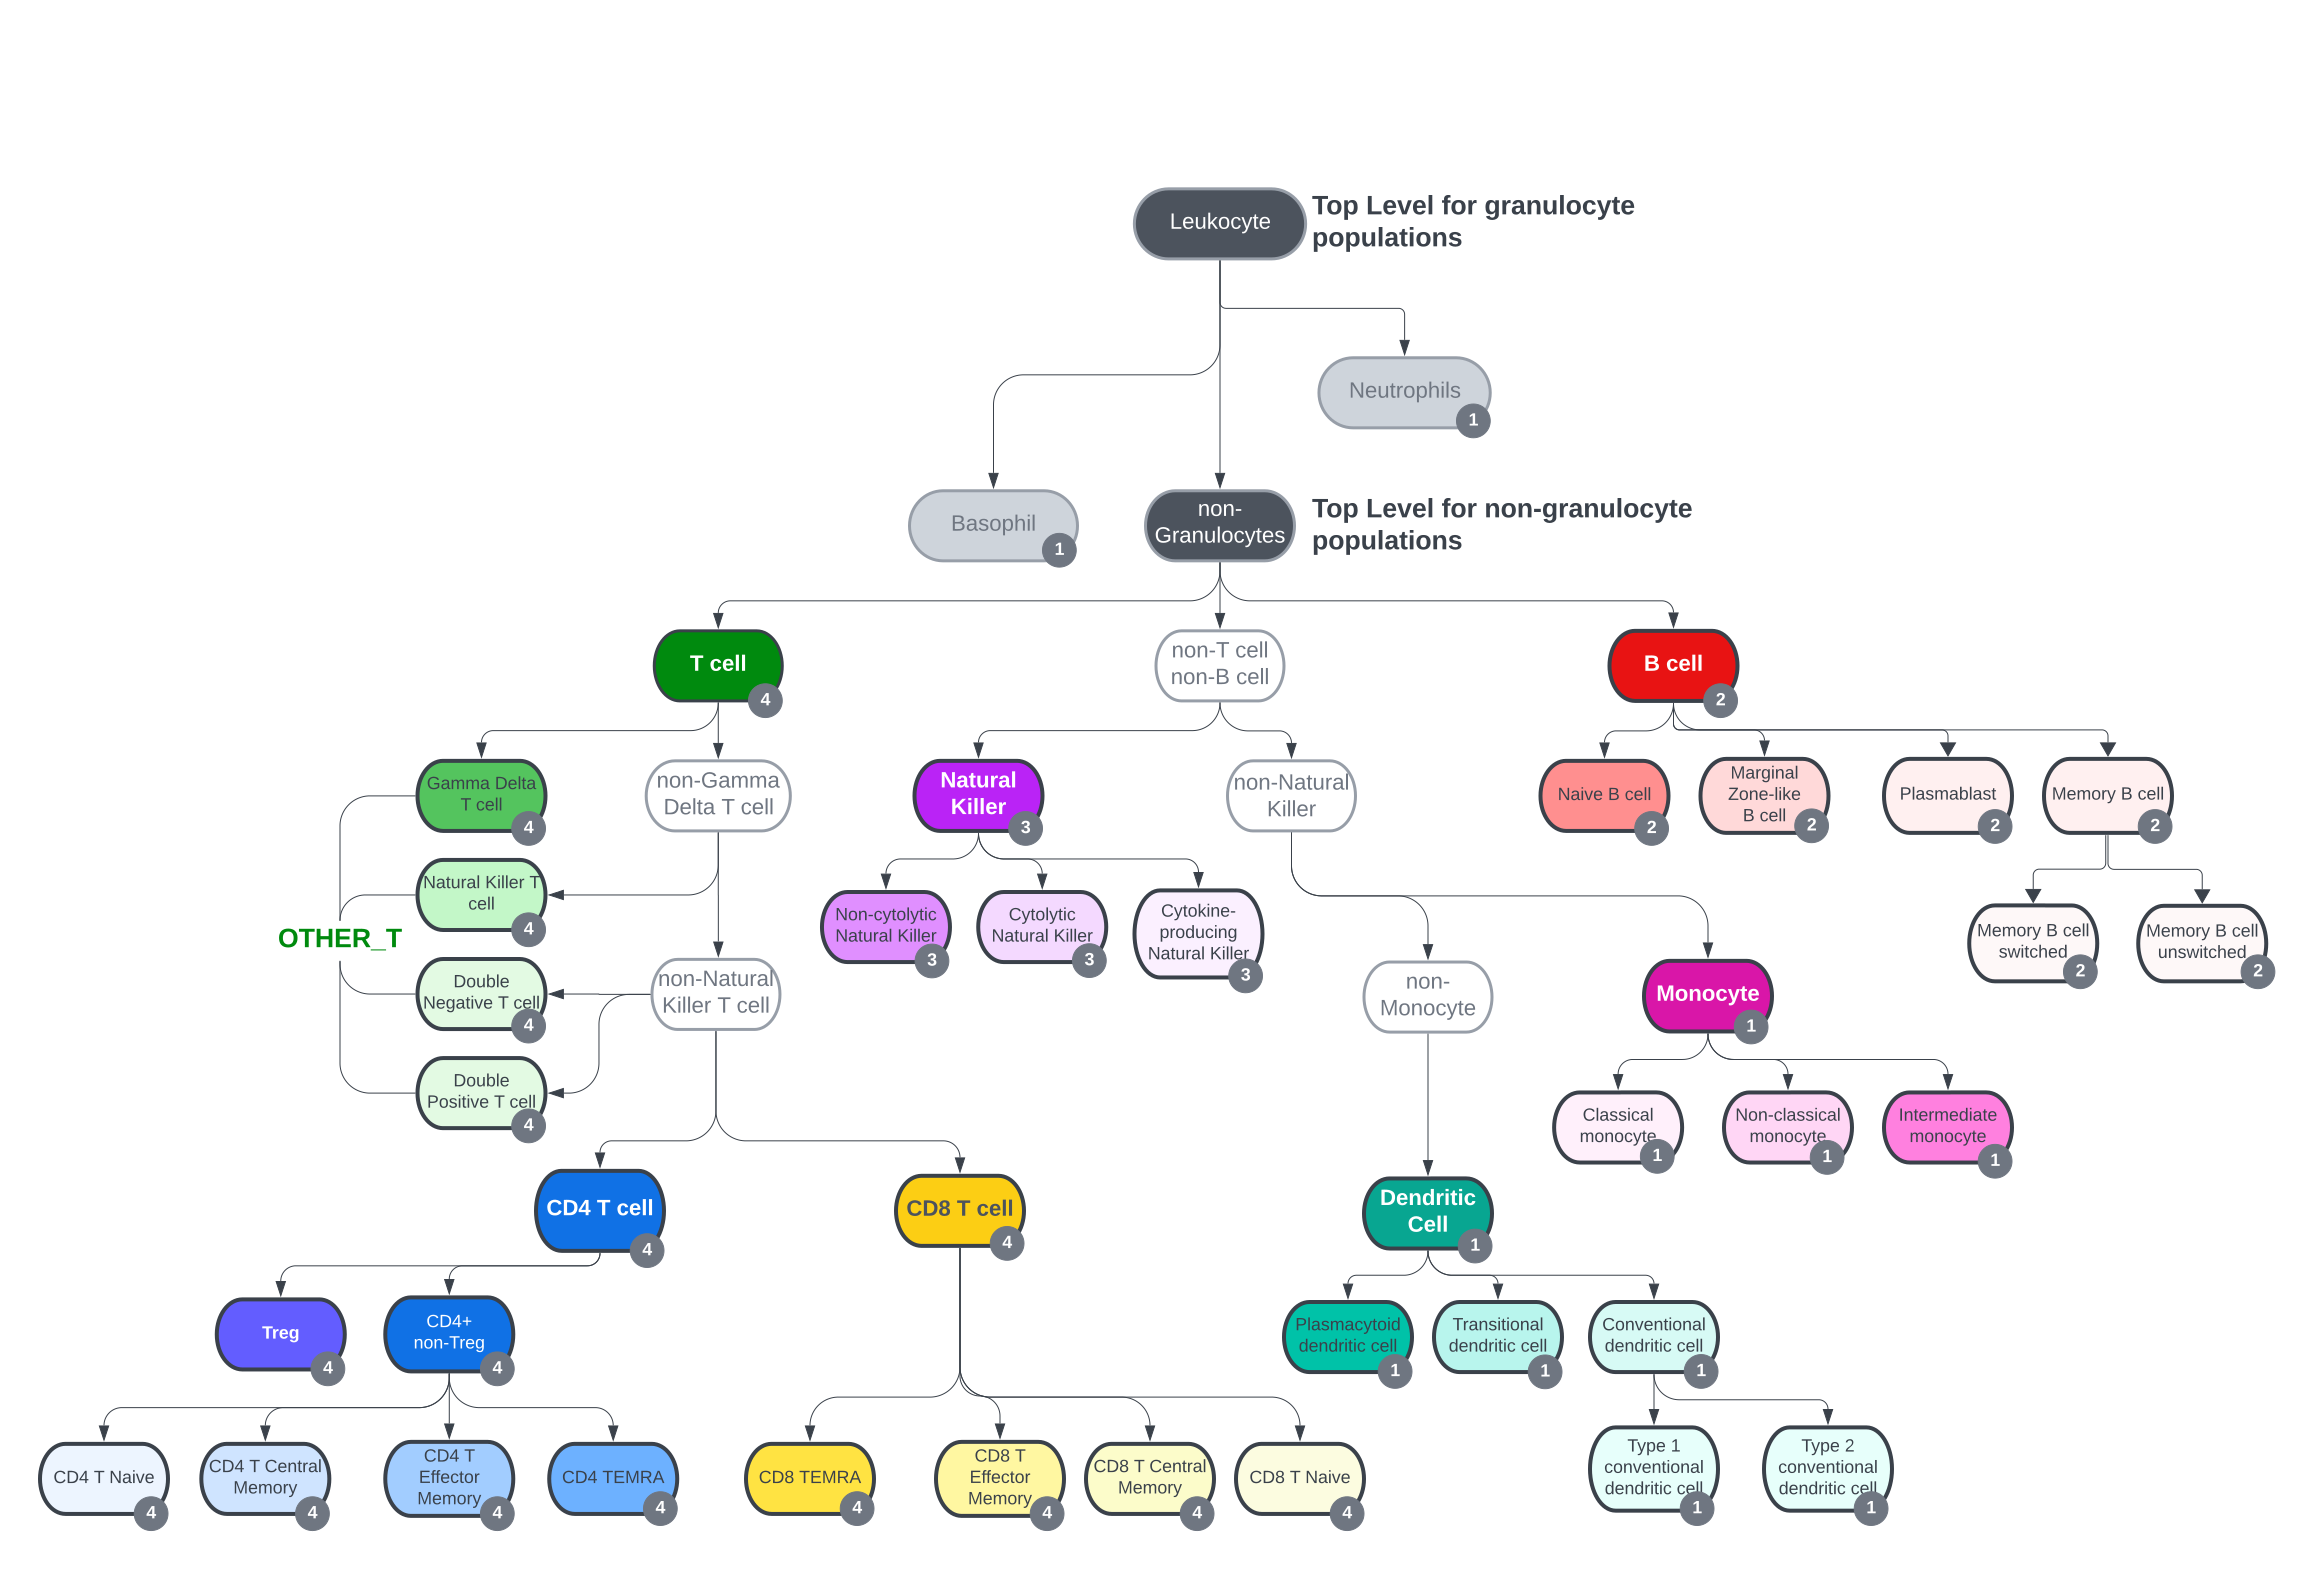
Each node is an immune subset the backbone resolves. The number on a node is how many cell state markers are measured on that subset.
| State marker | T cell | B cell | NK cell | Monocyte | Dendritic cell | Granulocyte |
|---|---|---|---|---|---|---|
| PD-1 | Yes | Yes | Yes | Yes | Yes | - |
| HLA-DR | Yes | - | Yes | - | - | Yes |
| CD38 | Yes | - | - | - | - | - |
| CD25 | - | Yes | - | - | - | - |
| CD8 | - | - | Yes | - | - | - |
| CD28 | Yes | - | - | - | - | - |
Custom panel development workflow
Our design process is tailored to meet the exact needs of your study.
Panel design
We design a panel that fits your biology. Markers are paired with the optimal fluorophores for signal intensity and separation, and we propose sample types and stimulation conditions so every target can be measured clearly.
See our 25-marker backbone panelAcquire and qualify antibodies
We source fluorophore-conjugated antibodies and request custom conjugations when needed, so every marker has the right clone and fluorophore match.
Optimize marker performance
Each custom antibody is titrated through a six-point dilution series to identify the concentration that gives the highest stain index with the least background and spillover.
Analysis and refinement
We evaluate unmixing quality, fluorescence balance, and signal resolution, then adjust fluorophore assignments or titers so the panel resolves every marker.
Validate the full panel with FMOs
We run the complete panel on representative samples with fluorescence-minus-one (FMO) controls for each custom marker, confirming clean gating and reproducible performance across major and rare populations.
View a panel verification reportFinal verification and reporting
We confirm sensitivity, reproducibility, and resolution of every immune subset. You receive a panel development report with the complete configuration, titration curves, FMO controls, and a full gating hierarchy with example plots.
Explore our gating strategyPanel development report
With every project, receive a report that includes the full panel configuration, an example gating scheme, and reference plots for functional marker staining.
Panel configuration
See the selected antibody clone, fluorophore, and staining concentration for each marker on the panel.
Example gating scheme
Visualize the panel's performance on a healthy human whole blood donor sample.
Stimulated and unstimulated controls
Compare functional marker staining in stimulated and unstimulated PBMC control samples.
Contact us for a free 30-minute panel development consultation
Tell us the markers and readouts your program needs, and we'll propose a configuration built on the 25-marker backbone or designed from scratch.