
When you are developing advanced targeted therapies like CAR-Ts, ADCs, or bispecifics, knowing if a target is present on a cell is no longer enough. You need to know exactly how much of it is there.
Traditionally, cytometry relies on relative signal intensities (median fluorescence intensity or median channel value) to interpret marker expression. But there’ss a big caveat: two markers expressed at the same level can produce different signals simply because one is assigned a brighter metal or fluorophore. On a relative scale, this reads as a difference in expression that isn't there.
Antigen density fixes this by normalizing the data into a single, universal metric: the absolute number of drug targets on a single cell. This removes the guesswork, giving an unbiased, apples-to-apples comparison across markers.
When designing a cytometry panel, scientists often assign bright fluorophores to low-expression markers to ensure they are visible above background, while highly abundant markers are assigned dimmer fluorophores to prevent spillover.
For example, assume CD25 is expected to be a low-expression marker, so it's assigned a bright fluorophore (PE); CD4 should be abundant, so it's on a dim one (BV570). Here's what the median fluorescence intensity (MFI) of CD25 and CD4 could look like after running a sample:
Based on the above chart, a reader might think that CD25 and CD4 are expressed at comparable levels on these cells, leading them to assume similar target availability.
With absolute antigen density, the picture is clearer.
Antigen density provides a standardized measure of target abundance across fluorophores with varying brightness, the absolute number of molecules per cell. With this conversion, a reader can now see that CD4 is expressed at 40X that of CD25 in the quantified cells.
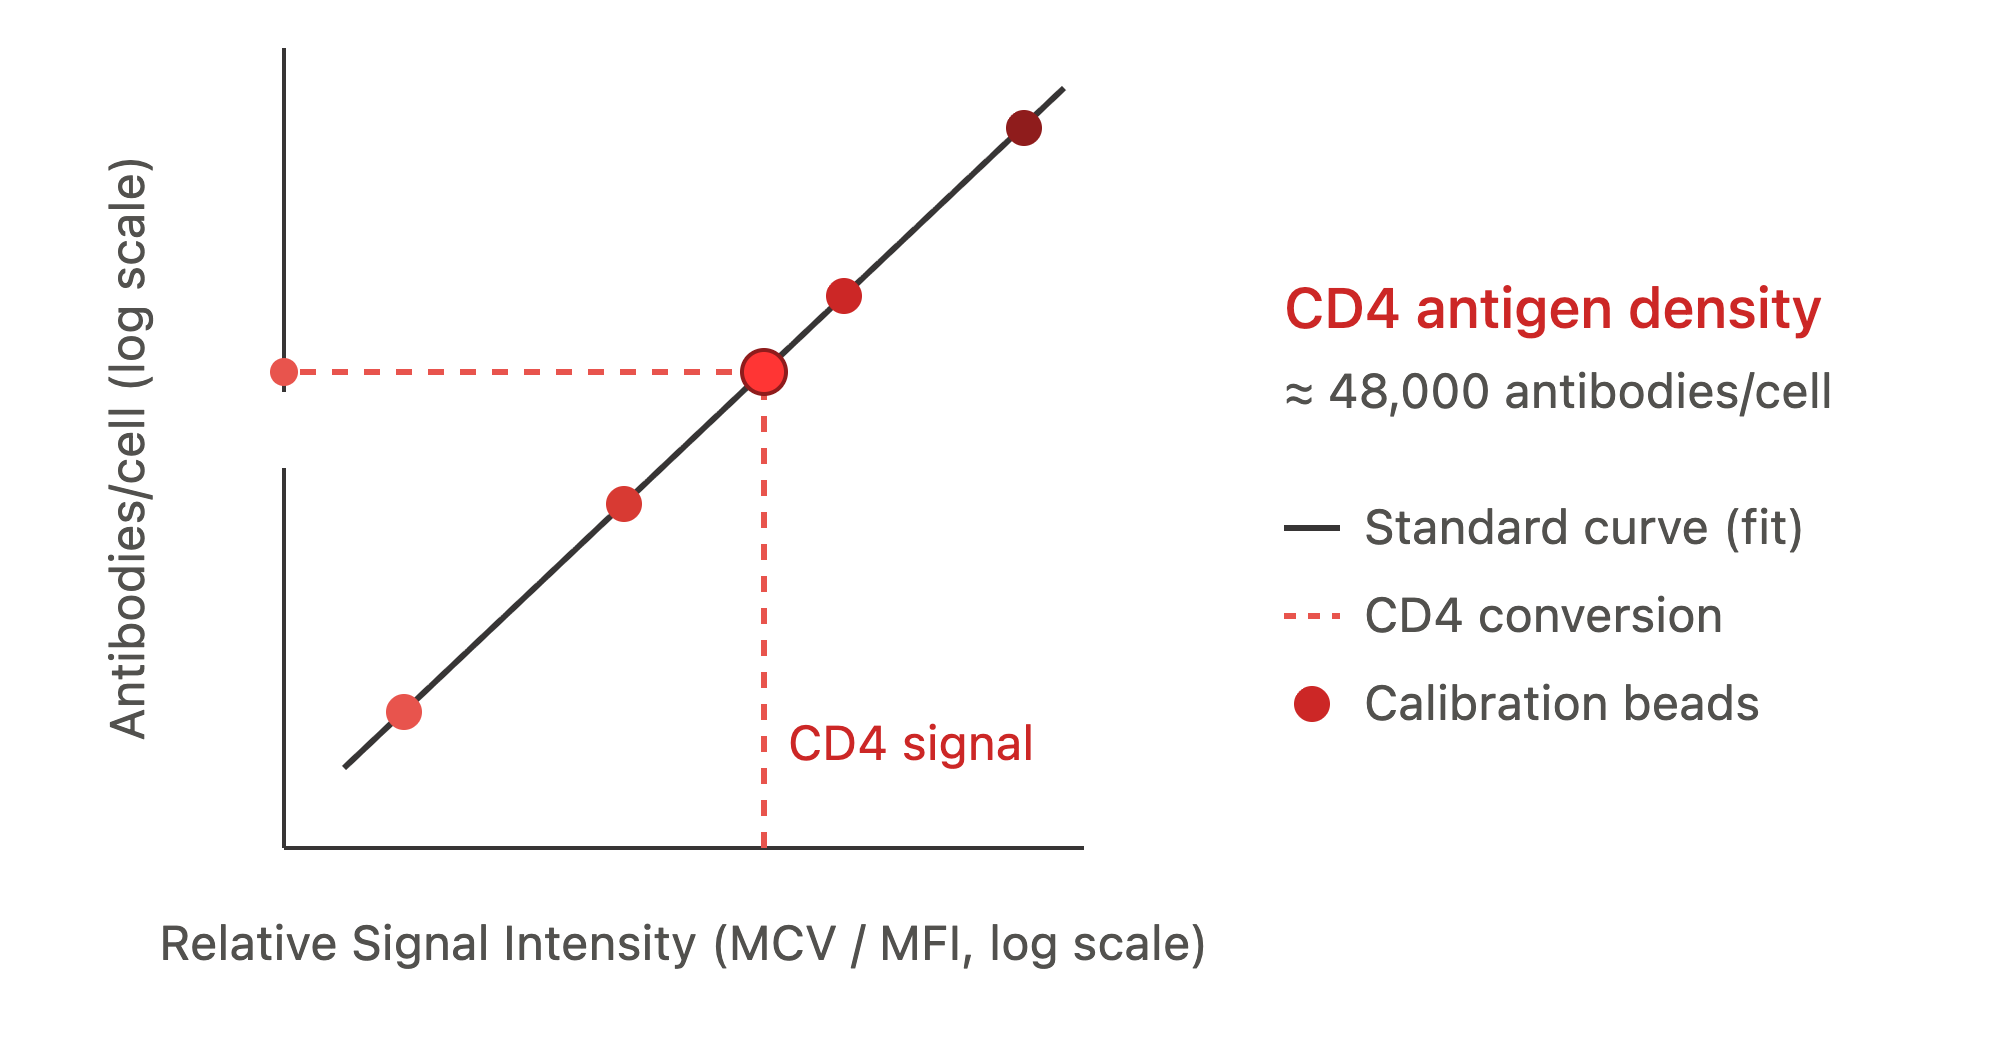
Antigen density is measured by comparing your sample against reference beads with known antibody binding capacities (ABC). When stained identically to your cells, the beads translate signals (MCV or MFI) into an absolute count of bound antibodies per cell. With this relationship, you can convert signals generated by your sample into the absolute number of target molecules per cell in your sample.
Here is the workflow, step by step.
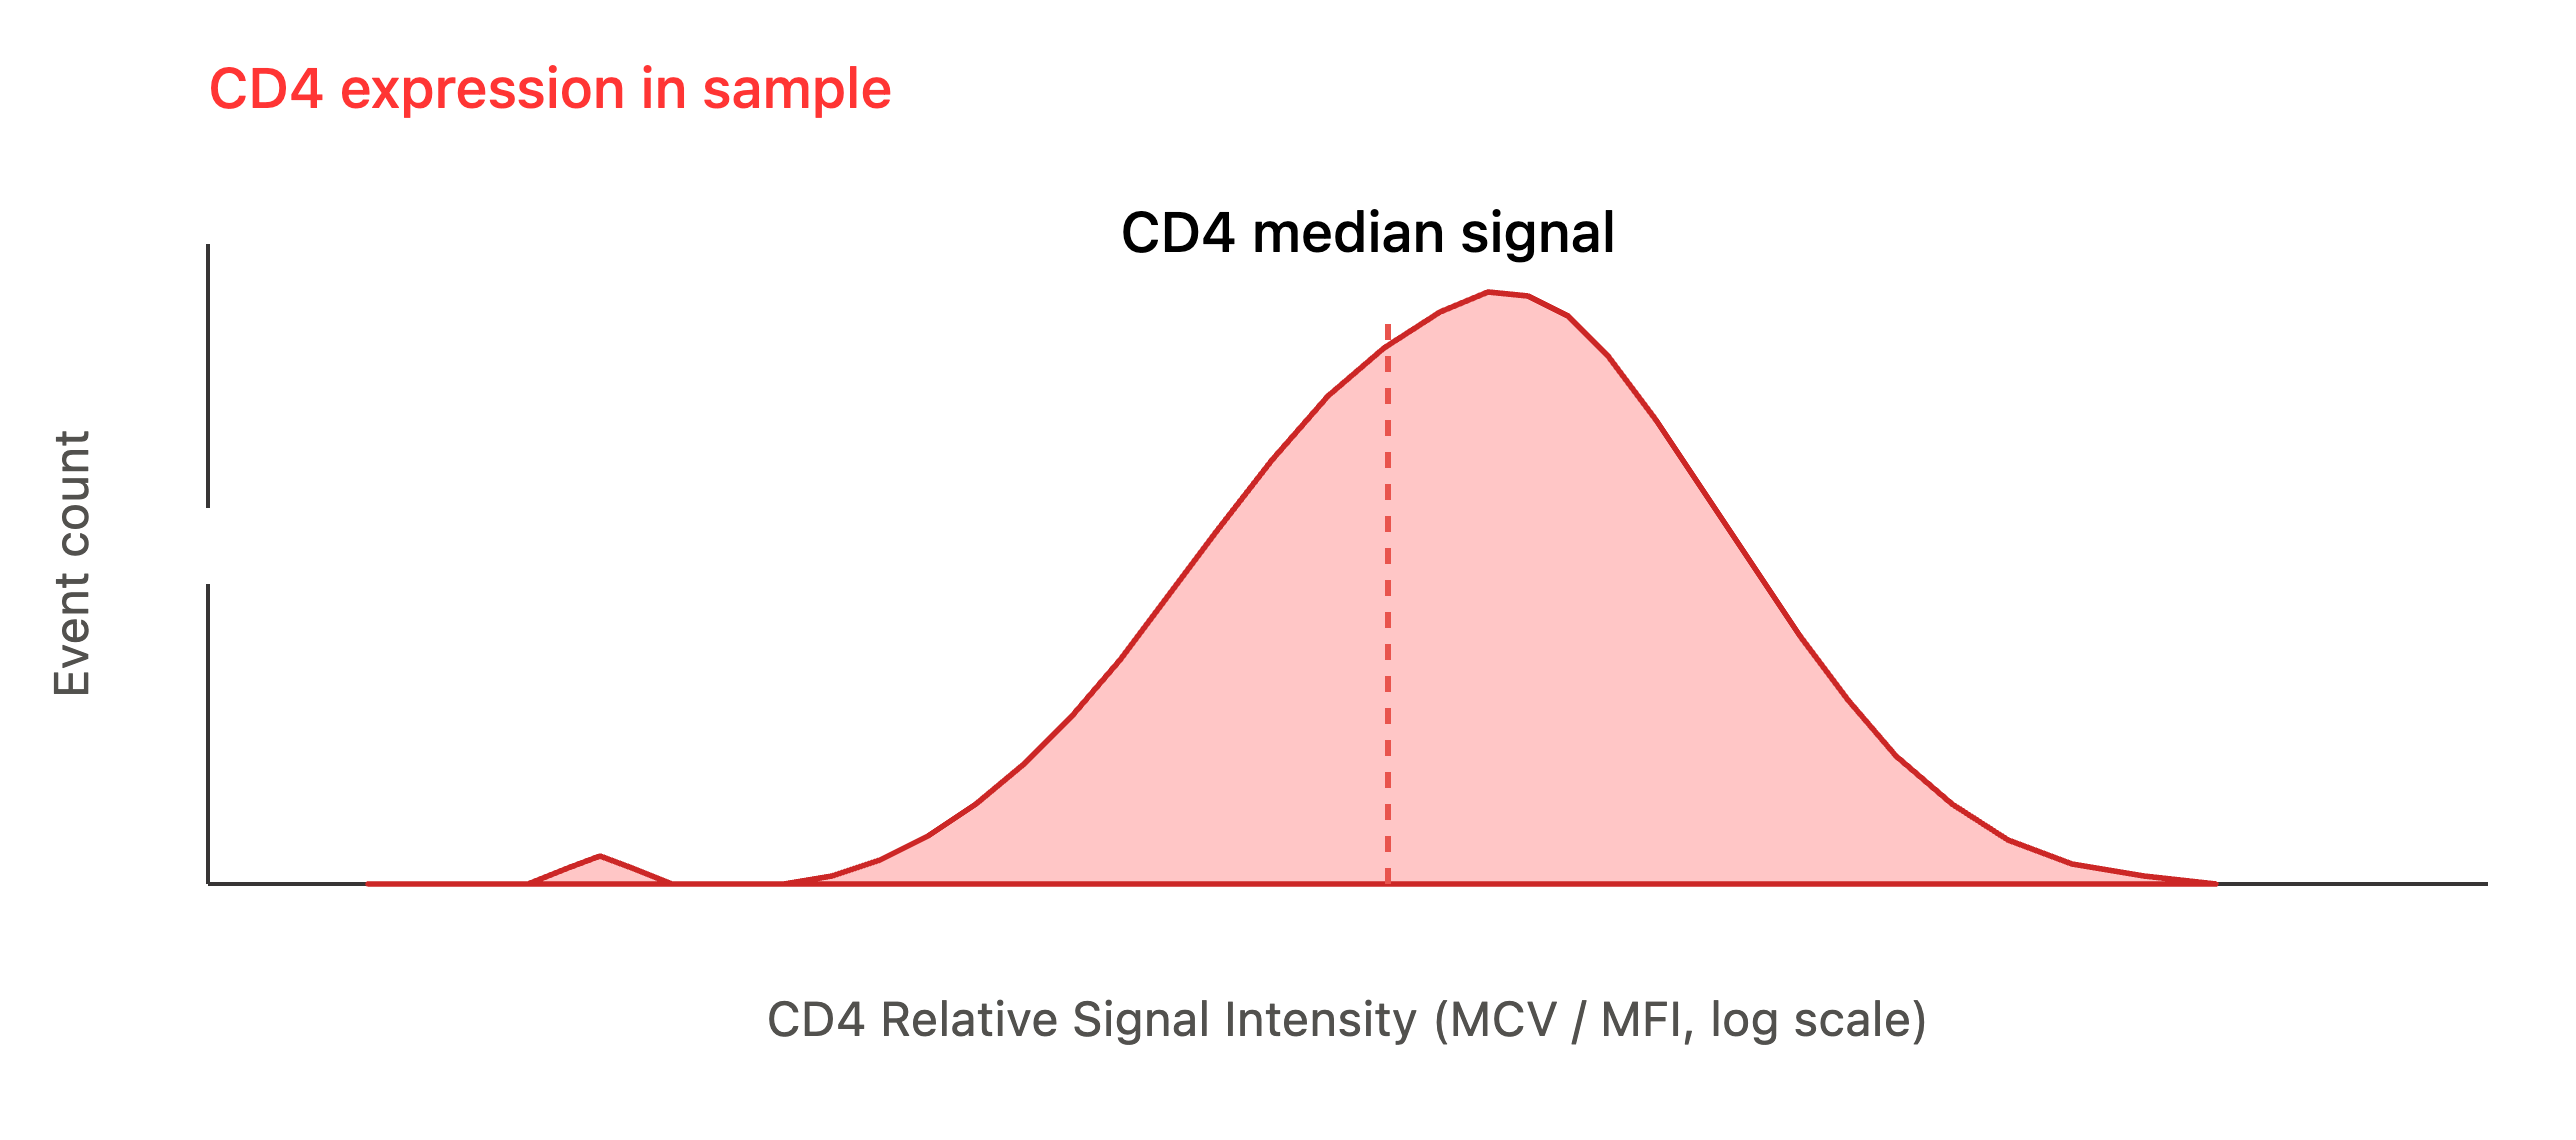
1. Stain and run your sample: Stain your sample with the antibody against your target, using a saturating concentration so that every available antigen is bound. Acquire the sample on the cytometer and record the median signal (MCV or MFI) for that marker.
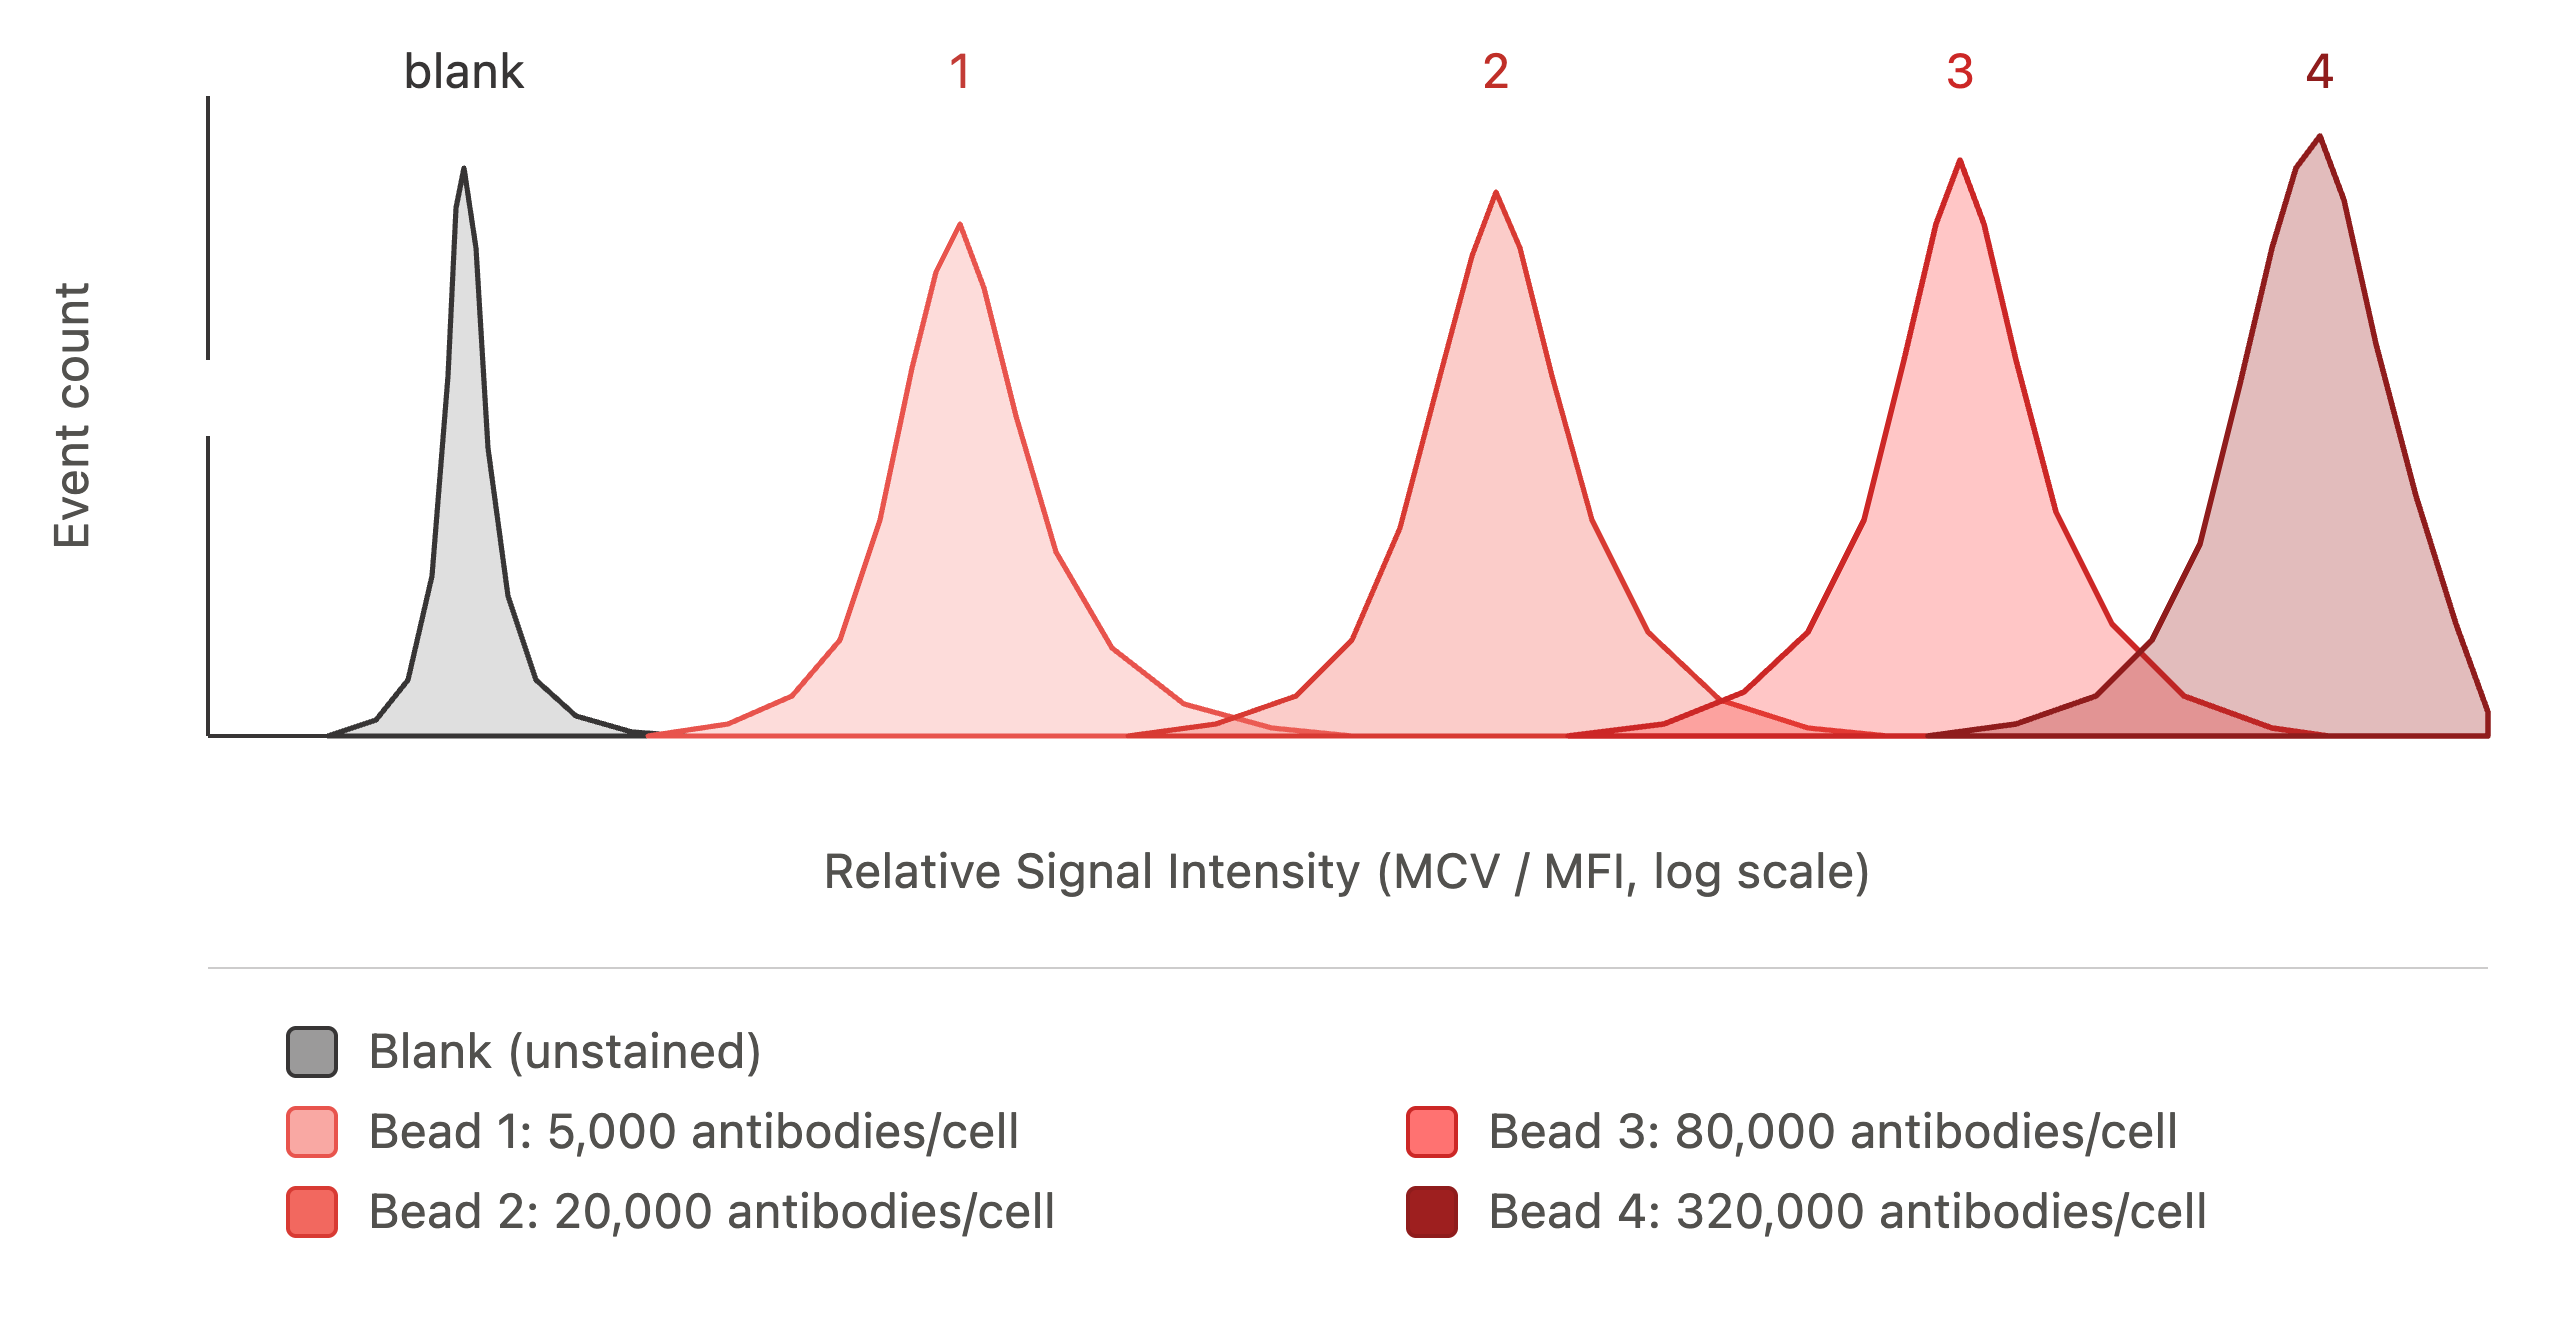
2. Run the calibration beads: Run a set of calibration beads stained with the same antibody, and record the median signal (MCV or MFI) for each bead. The set contains several bead populations, each with a certified, known antibody binding capacity.
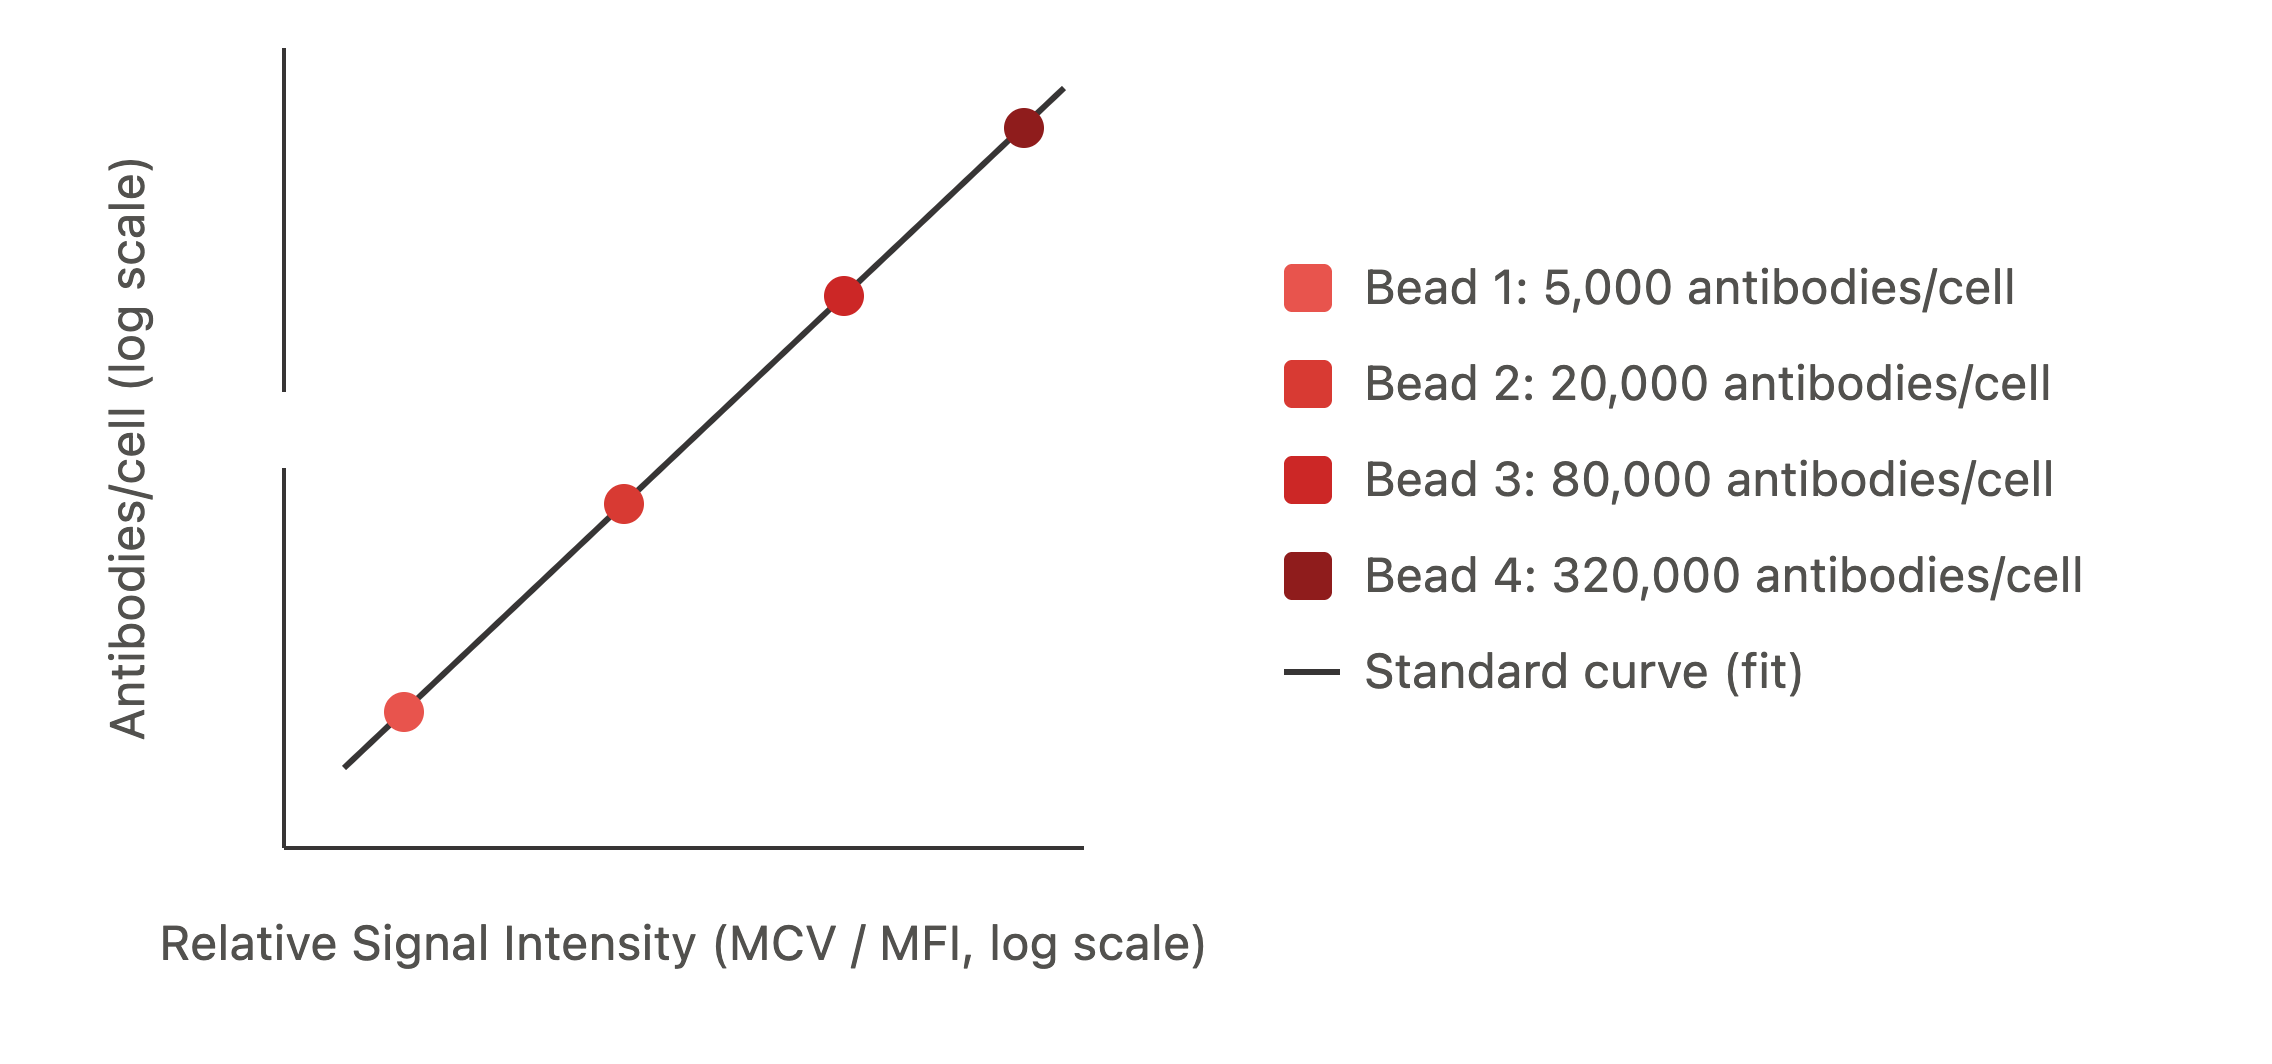
3. Generate the standard curve: Each bead population produces its median signal (MCV or MFI). Plot the known antibody binding capacity for each bead against the signal it generates. The points line up predictably (on a log scale), and that line becomes your standard curve: the equation that converts MCV or MFI into an absolute number of molecules.
4. Convert your sample's signal: Take the median signal from your stained cells and read it against the standard curve. The curve returns the number of antibodies bound per cell, which is your antigen density: the number of target molecules on a single cell.
For a clinical trial team, this absolute number can provide critical data for making decisions for your trial:
Drug development is a game of numbers. Antigen density ensures you are measuring the exact thresholds that dictate clinical response, safety, and regulatory success.

.png)
.png)