Are cytometry results consistent across TokuKit lots?

Yes. Samples processed with different lots of TokuKit see a mean coefficient of variation of <6% across cell population and functional subset frequencies.
Inter-lot Comparison
See minimal changes in the inter-lot coefficient of variation (CV) across cell populations and functional subsets.
  • 3.53%
    Mean inter-lot CV for population frequencies
  • 5.66%
    Mean inter-lot CV for functional marker subset frequencies

Post-fixation Stability

TokuKit-fixed samples show consistent staining patterns

Across three independent lots

Gating strategies for each donor, across lots.

Lot One

Lot Two

Lot Three

Lot One

Lot Two

Lot Three

Lot One

Lot Two

Lot Three

Functional marker staining for each donor, across lots.

Lot One

Lot Two

Lot Three

Lot One

Lot Two

Lot Three

Lot One

Lot Two

Lot Three

Experimental Design

Evaluation of population and functional subset frequencies across three TokuKit lots.

Experiment Plan

Sample Collection:

Whole blood was collected from 3 healthy donors into EDTA tubes. Replicates were split across three lots of TokuKit's Buffer One with different approximate times to expiry: 6 months, 9 months, and 18 months.

Each sample was left in TokuKit's Buffer One for 15 minutes, transferred to Buffer Two and separated into three aliquots and frozen at -80C.

Timeline

Each aliquot will be run at a separate timepoint: the same week of collection, after three months of storage, and after six months of storage.

The first timepoint has been run and this page will be updated as new results become available.
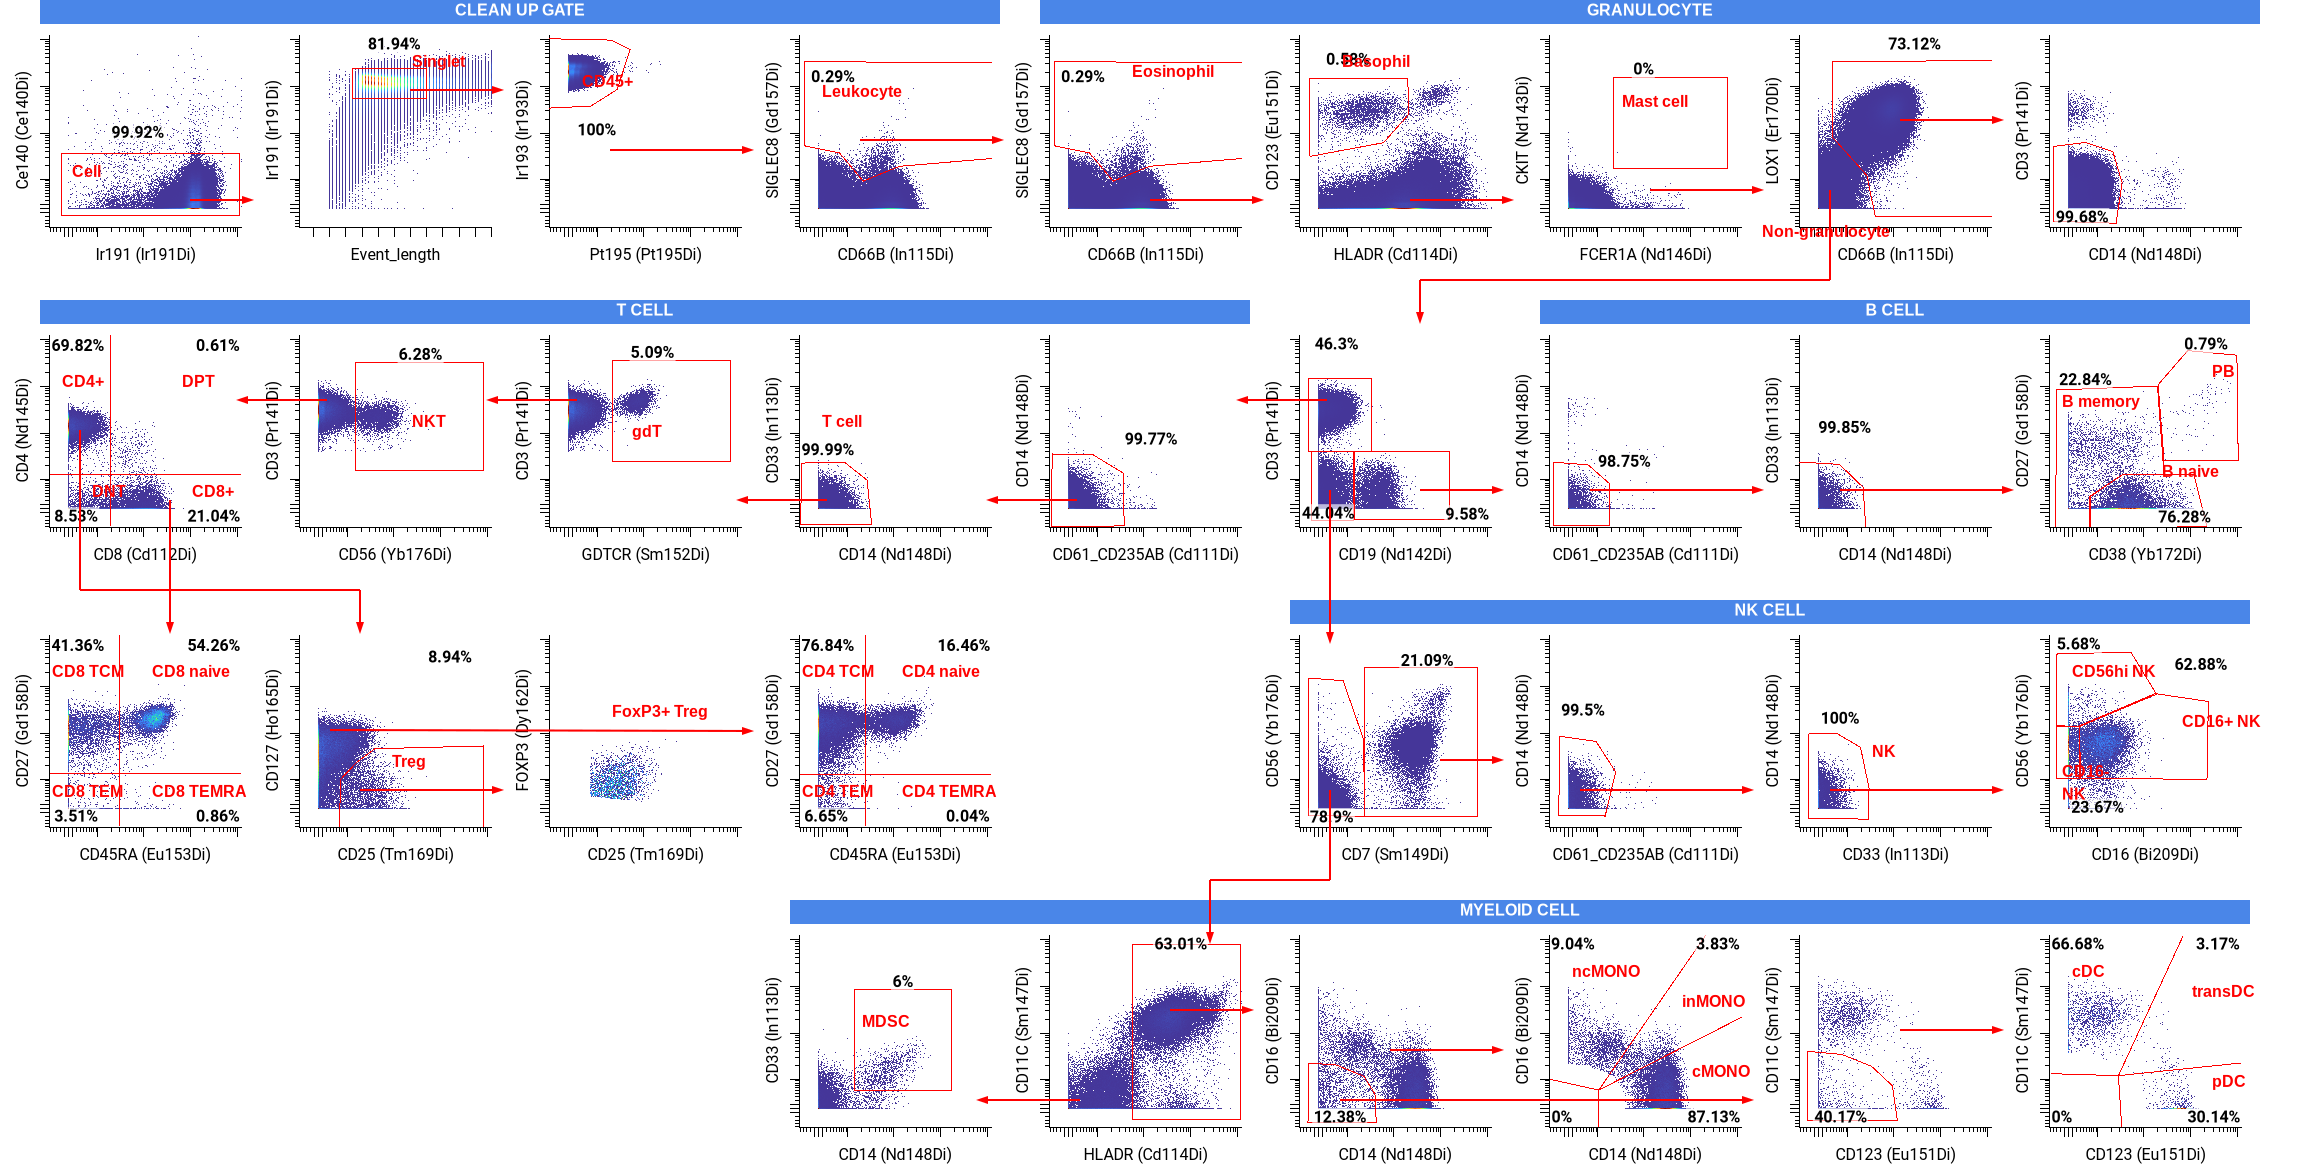
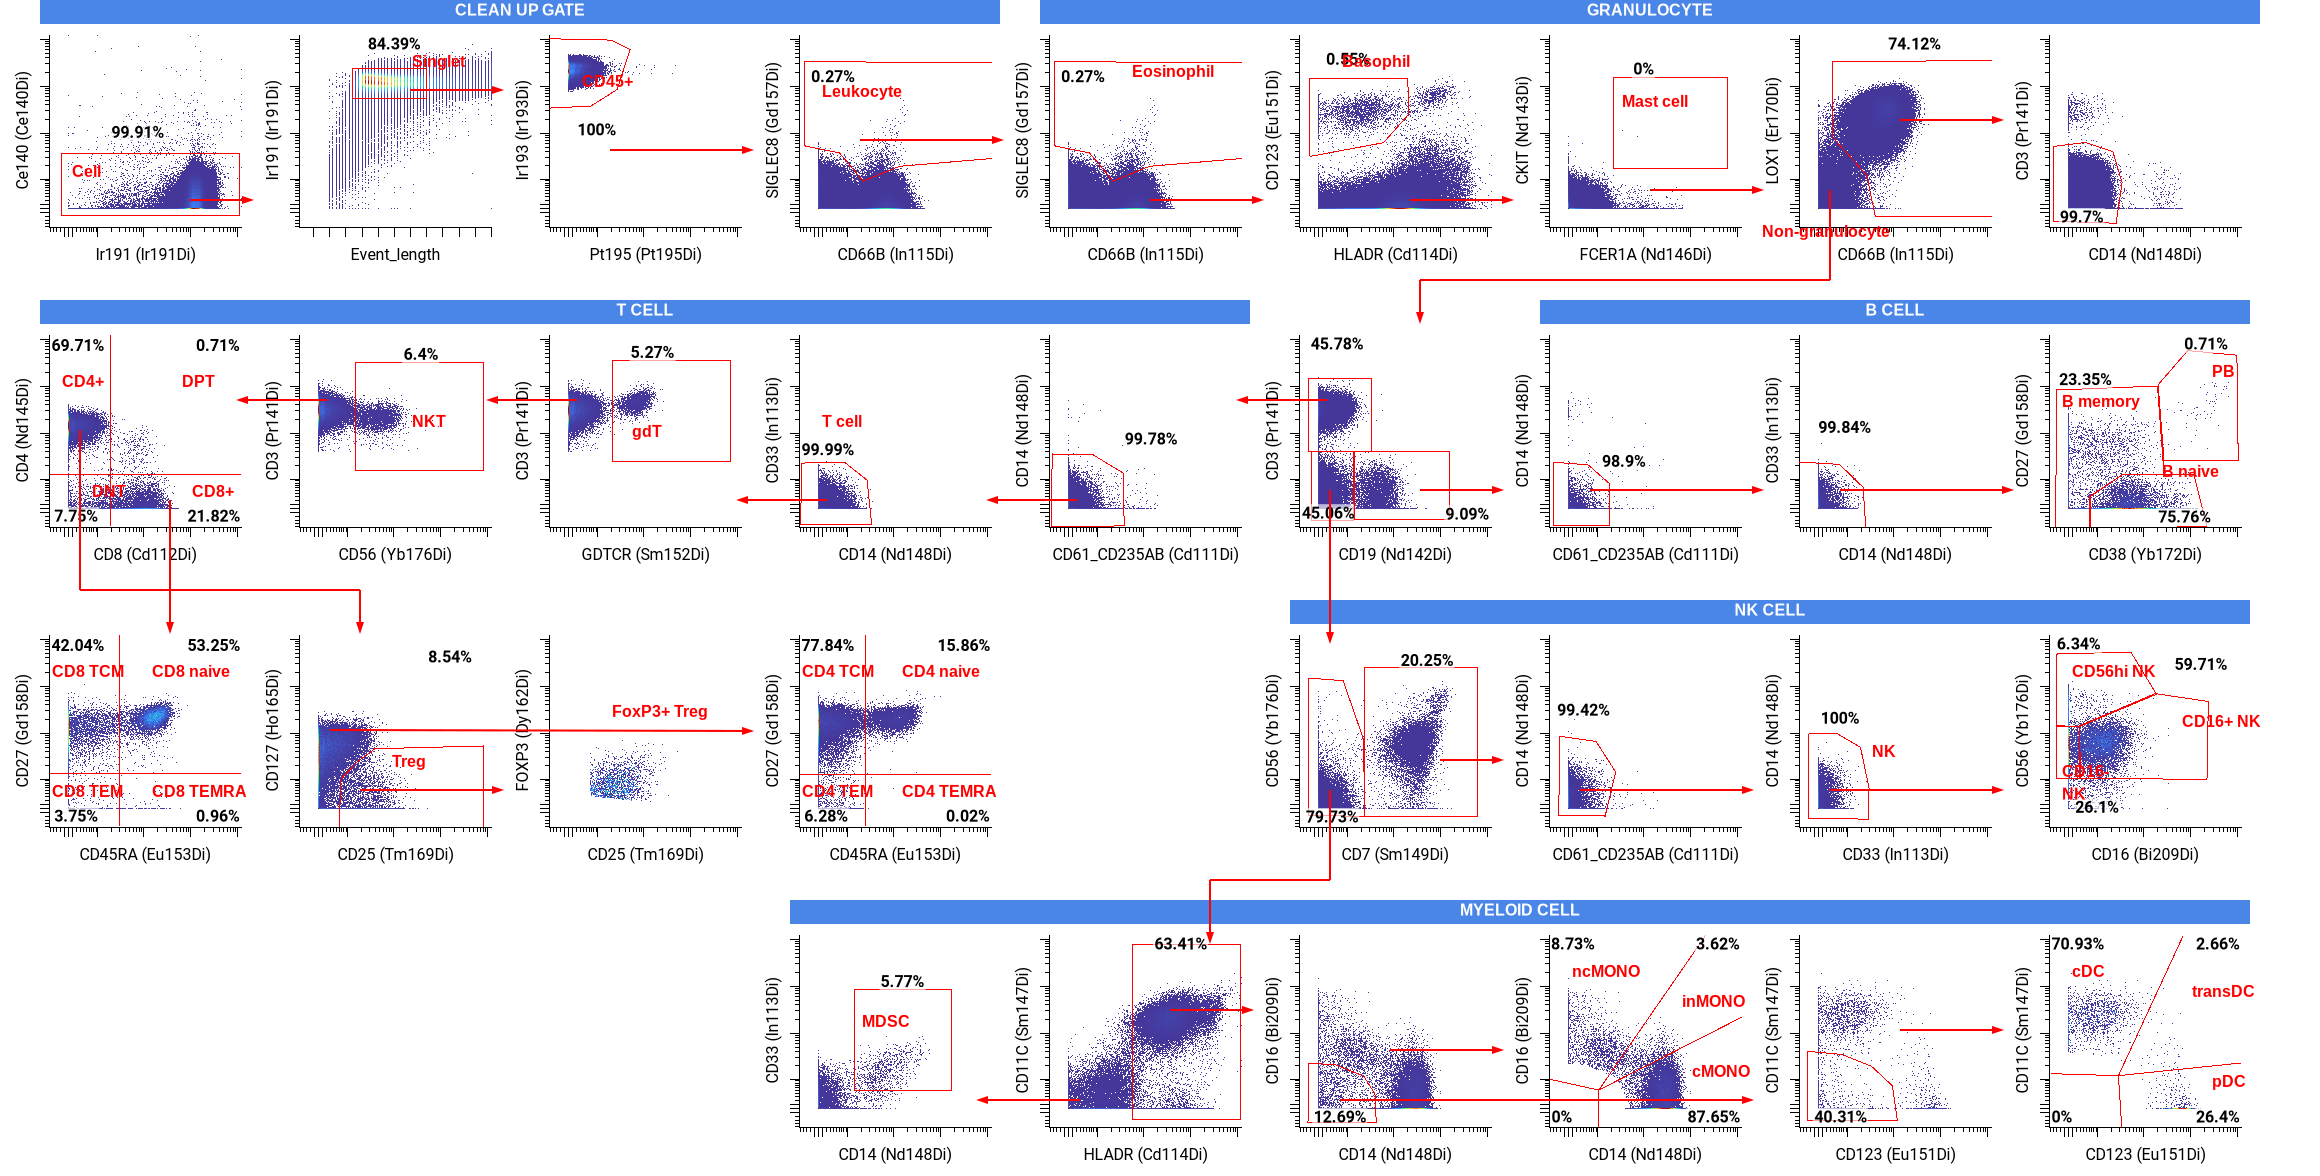
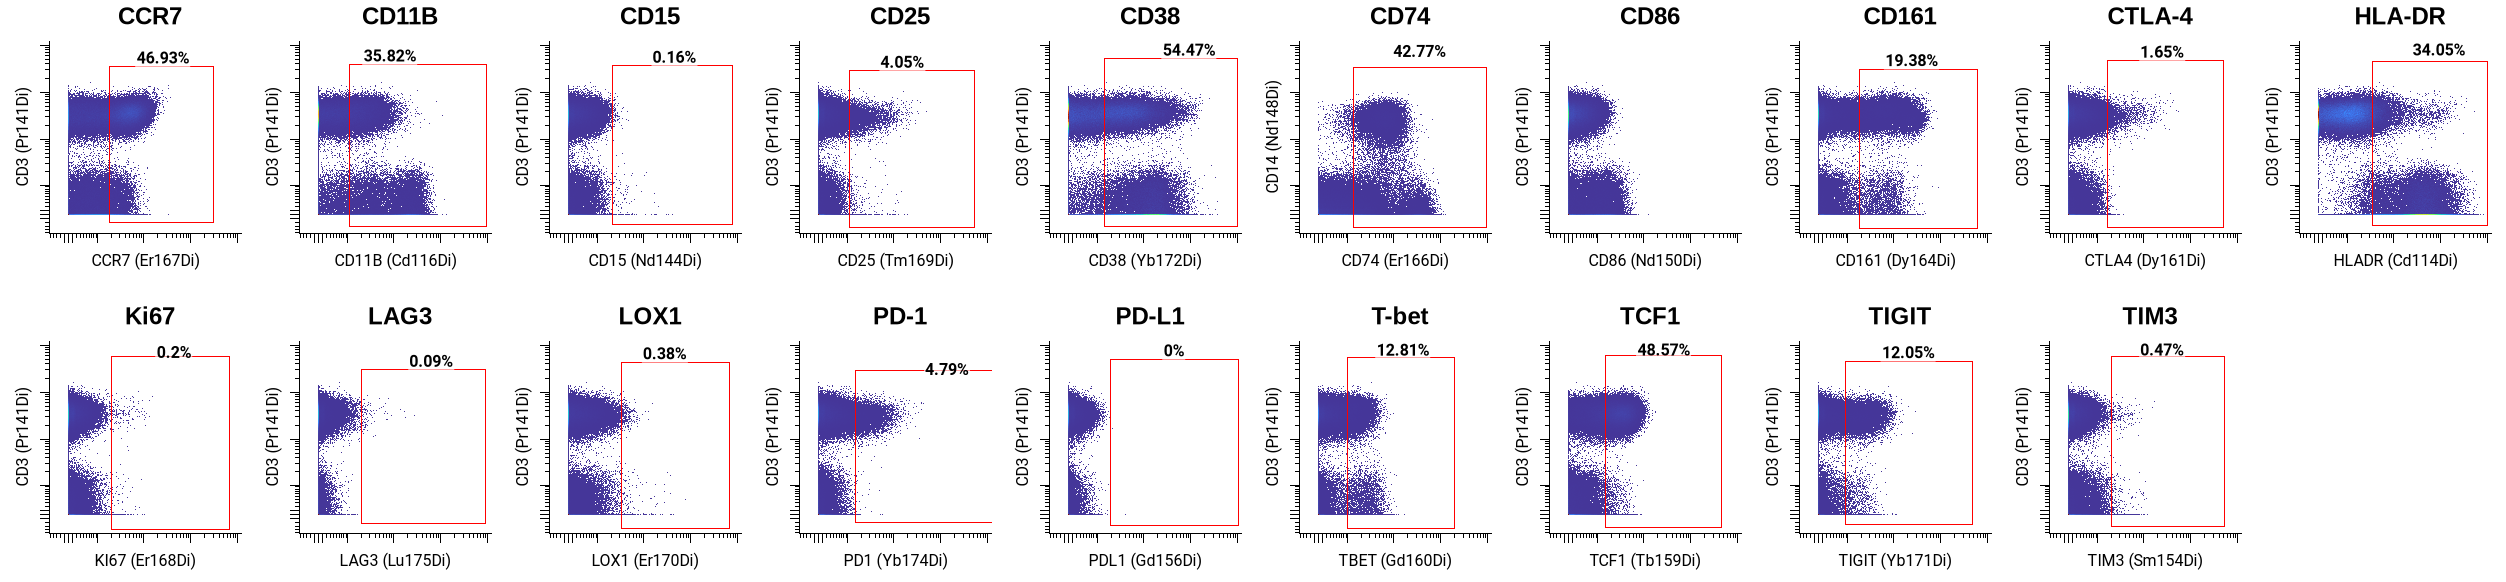
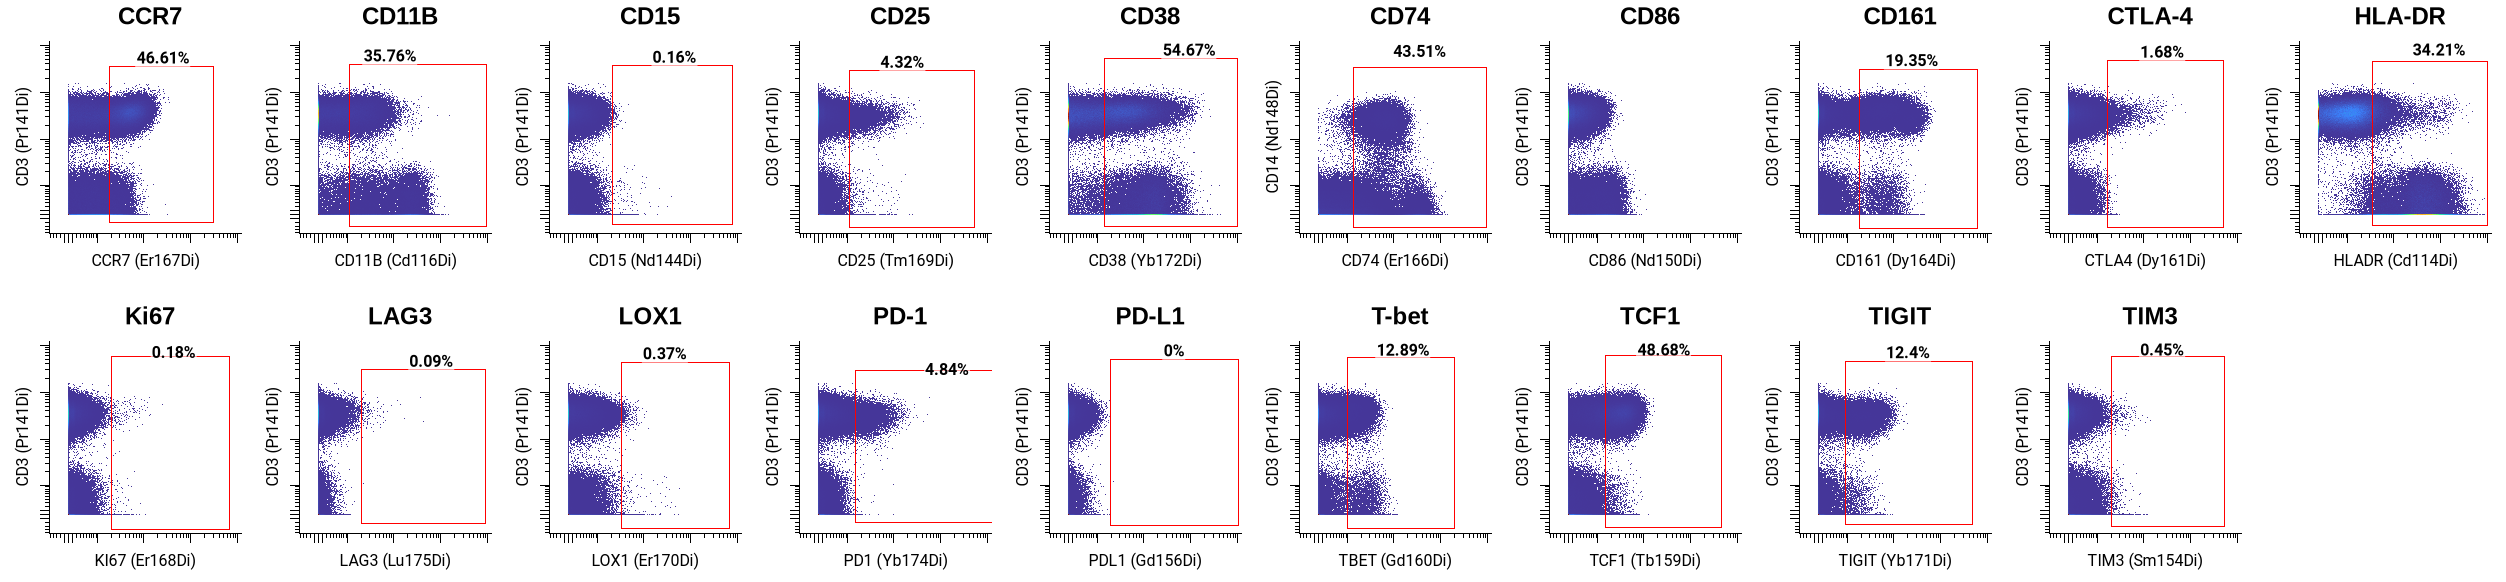
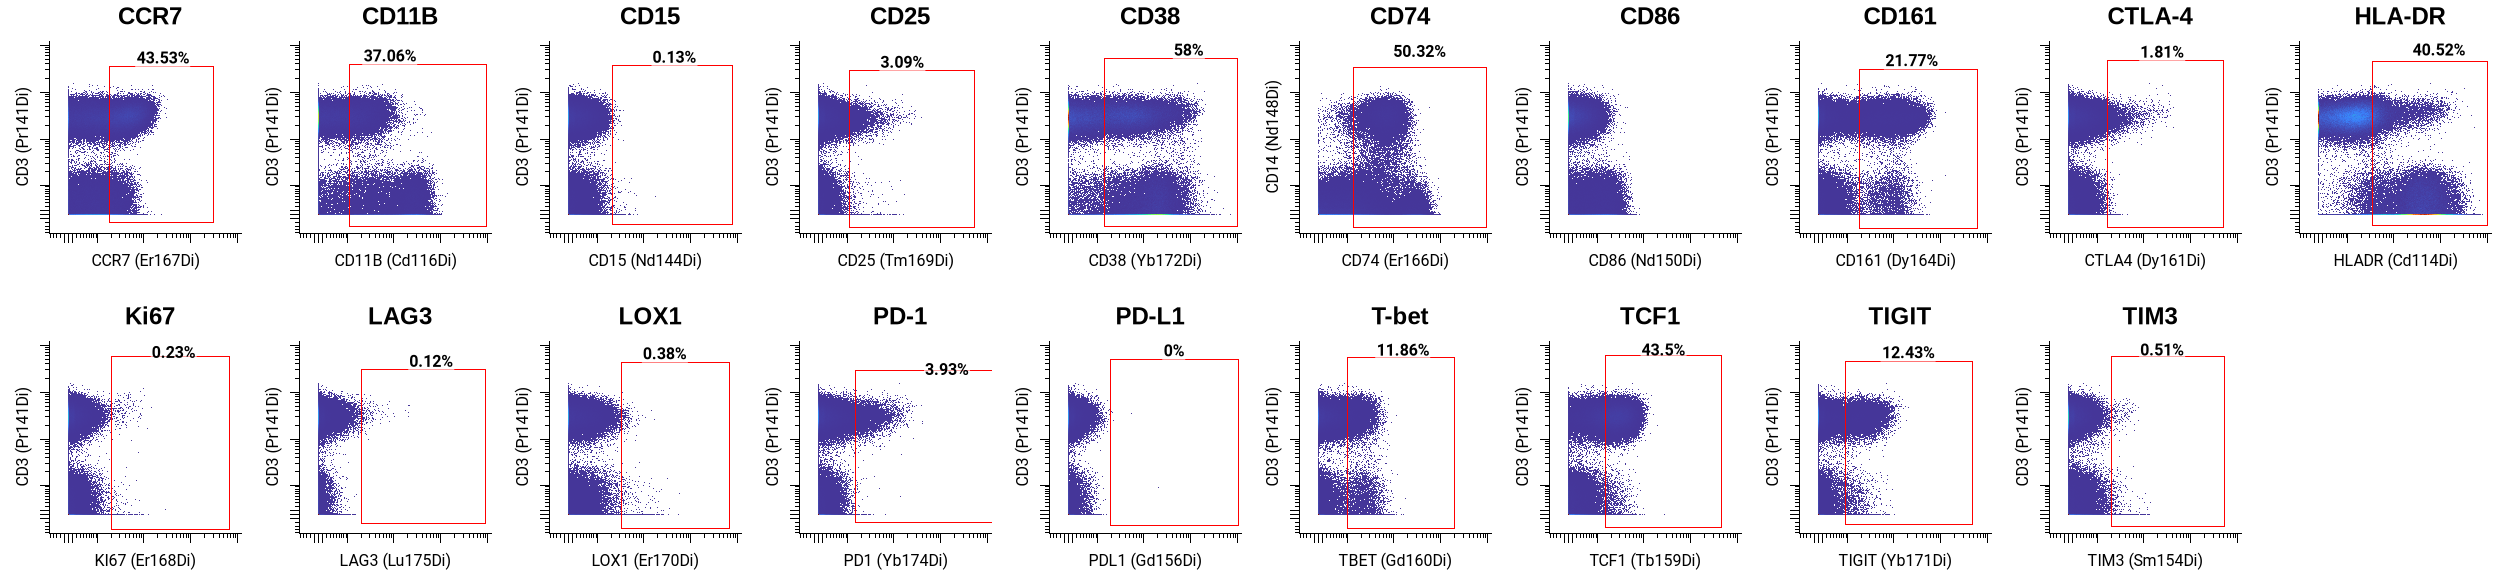
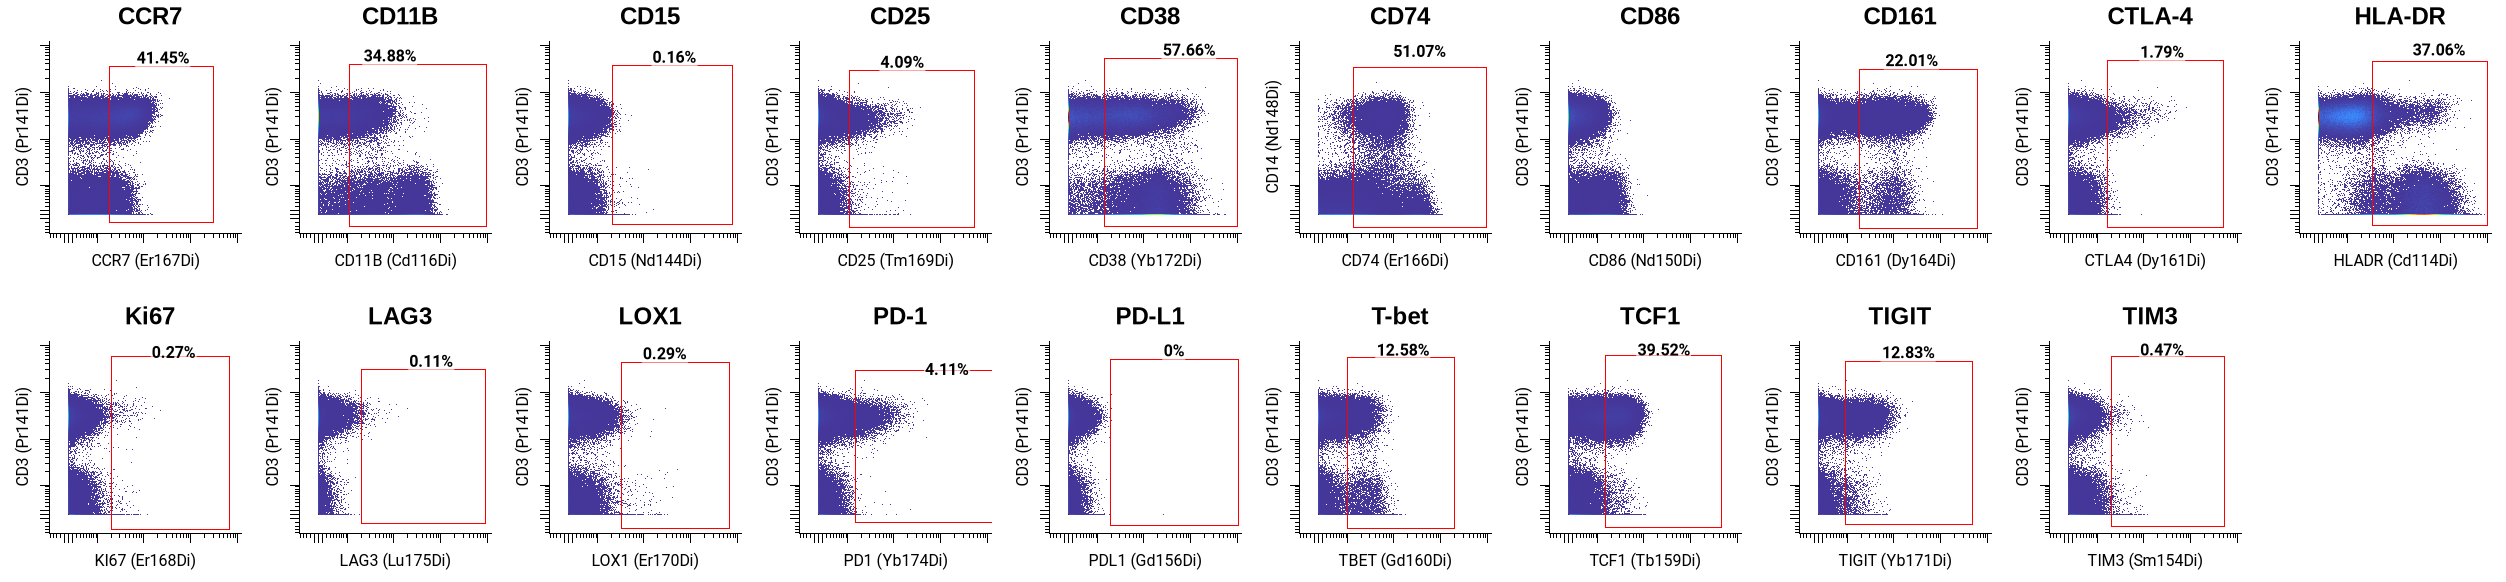
Panel Design

A 41-marker mass cytometry panel was applied to assess the immune cell populations visualized in the gating strategy below.

Instrument

Cytometry analysis was performed on a CyTOF Helios.

Want to try TokuKit on your next trial?

Contact Us

Thank you! Your submission has been received!
Oops! Something went wrong while submitting the form.