When comparing immune cell frequencies between patient groups – response, time points, doses, indications etc. – in a clinical trial, we often get asked the question: is the difference I’m seeing real biology, or could it be explained by technical variation in the assay?
In longitudinal cytometry profiling, samples arrive in batches over the course of a trial and are processed across multiple runs. Each run introduces some degree of variability. Without a way to quantify that variability, it’s difficult to confidently interpret group-level differences, even when they reach statistical significance.
Immune Changes plots on the Teiko dashboard can now display inter-run coefficient of variation (CV) bands derived from control samples processed alongside study samples.
For projects with multiple sample runs, Teiko includes control samples – either PBMCs or fixed whole blood – in each run. Because the same control material is run repeatedly, we can calculate the inter-run CV for every immune cell population. That CV is then converted into a band overlaid directly on the plot, giving an immediate visual reference for the expected spread of the assay under controlled conditions.
The feature is available as a toggle (“Show assay variability (Inter-run CV)”) on any Immune Changes plot for projects with multiple run batches.
Here’s an example. In a study evaluating immune changes in response to treatment, samples were collected at baseline and at the time of maximum immune-related adverse event (IRAE). Frequencies of each immune cell population were calculated, normalized to baseline, and plotted as absolute change from baseline, comparing nonresponders and responders.
A visual difference was observed in classical monocytes between the two groups, and a Student’s t-test confirmed statistical significance (p = 0.018). But the question remains: is this a real biological signal, or could it be explained by assay noise?

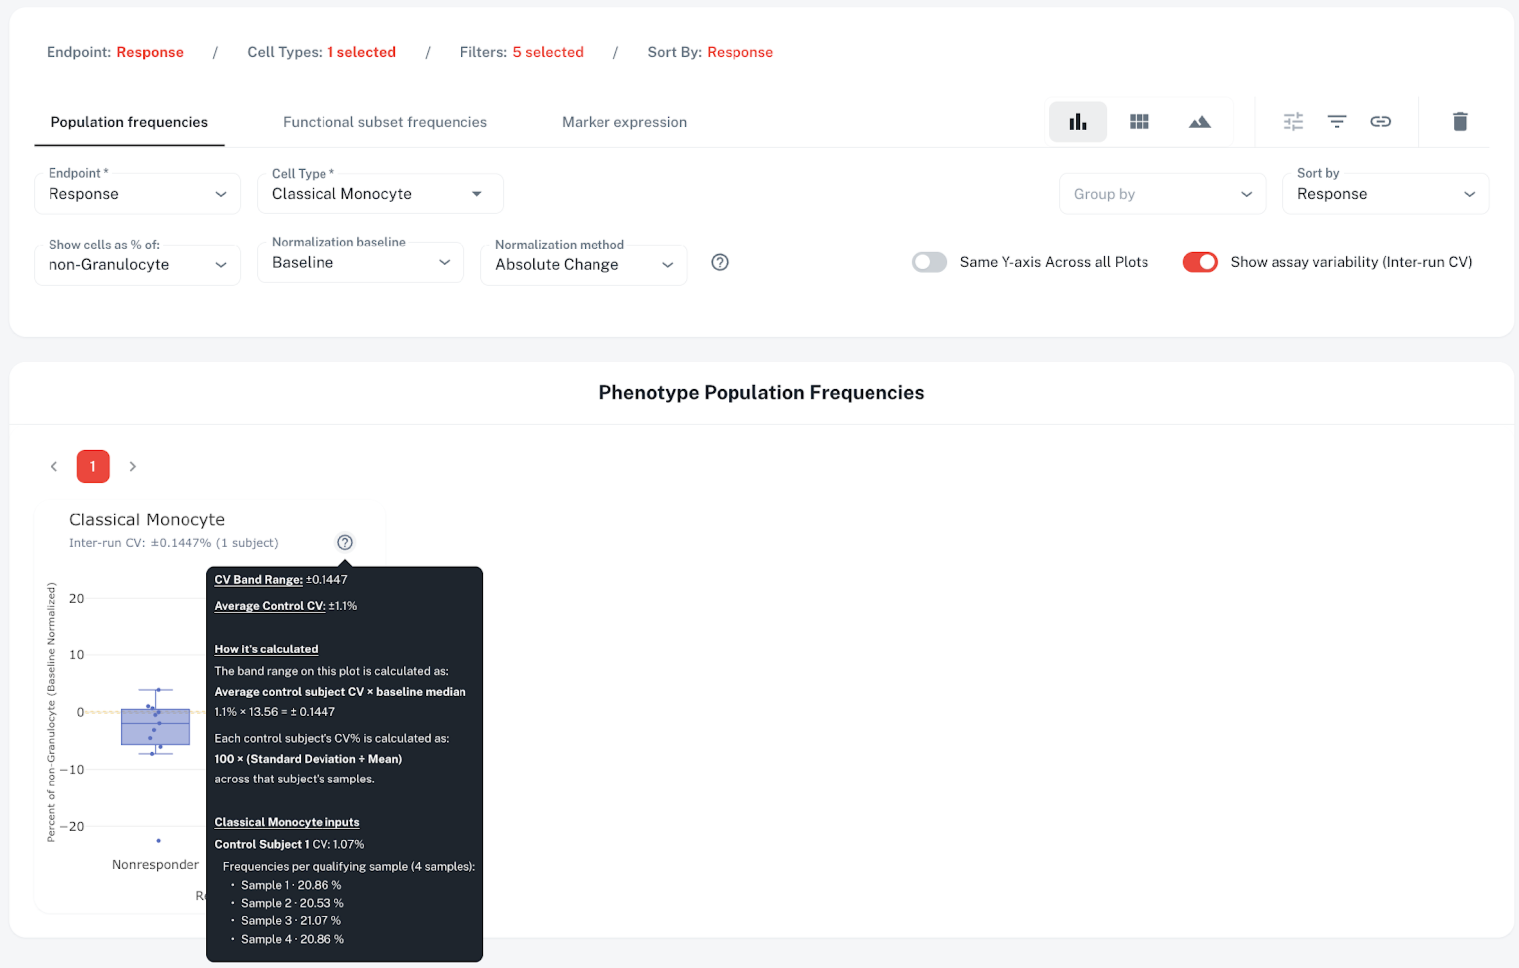
This is where the CV band comes in. The yellow band around zero represents the inter-run CV. In this case, one control sample was processed across four runs, with classical monocyte frequencies of 20.86%, 20.53%, 21.07%, and 20.86%, yielding a CV of approximately 1.1%. The band range is calculated as:
The responder group’s median change from baseline sits clearly above the CV band, while nonresponders cluster near zero within the band. Combined with a p-value of 0.018, this gives confidence that the observed increase in classical monocytes among responders reflects a genuine biological signal, not technical noise from processing samples across different runs.
Without these bands, teams are left wondering whether they are seeing a real clinical change, or noise from your CRO. These bands, coupled with p-values, give translational teams confidence in making sense of the results.
CV bands are available now for all projects with multiple sample run batches. Toggle the feature on any Immune Changes plot in the Teiko dashboard.


.png)