Teiko's TokuProfile Dashboard now includes antigen density visualizations. For projects that include per-cell antigen density measurement, view the absolute number of target molecules per cell across every profiled immune population, alongside your existing frequency and marker expression results.
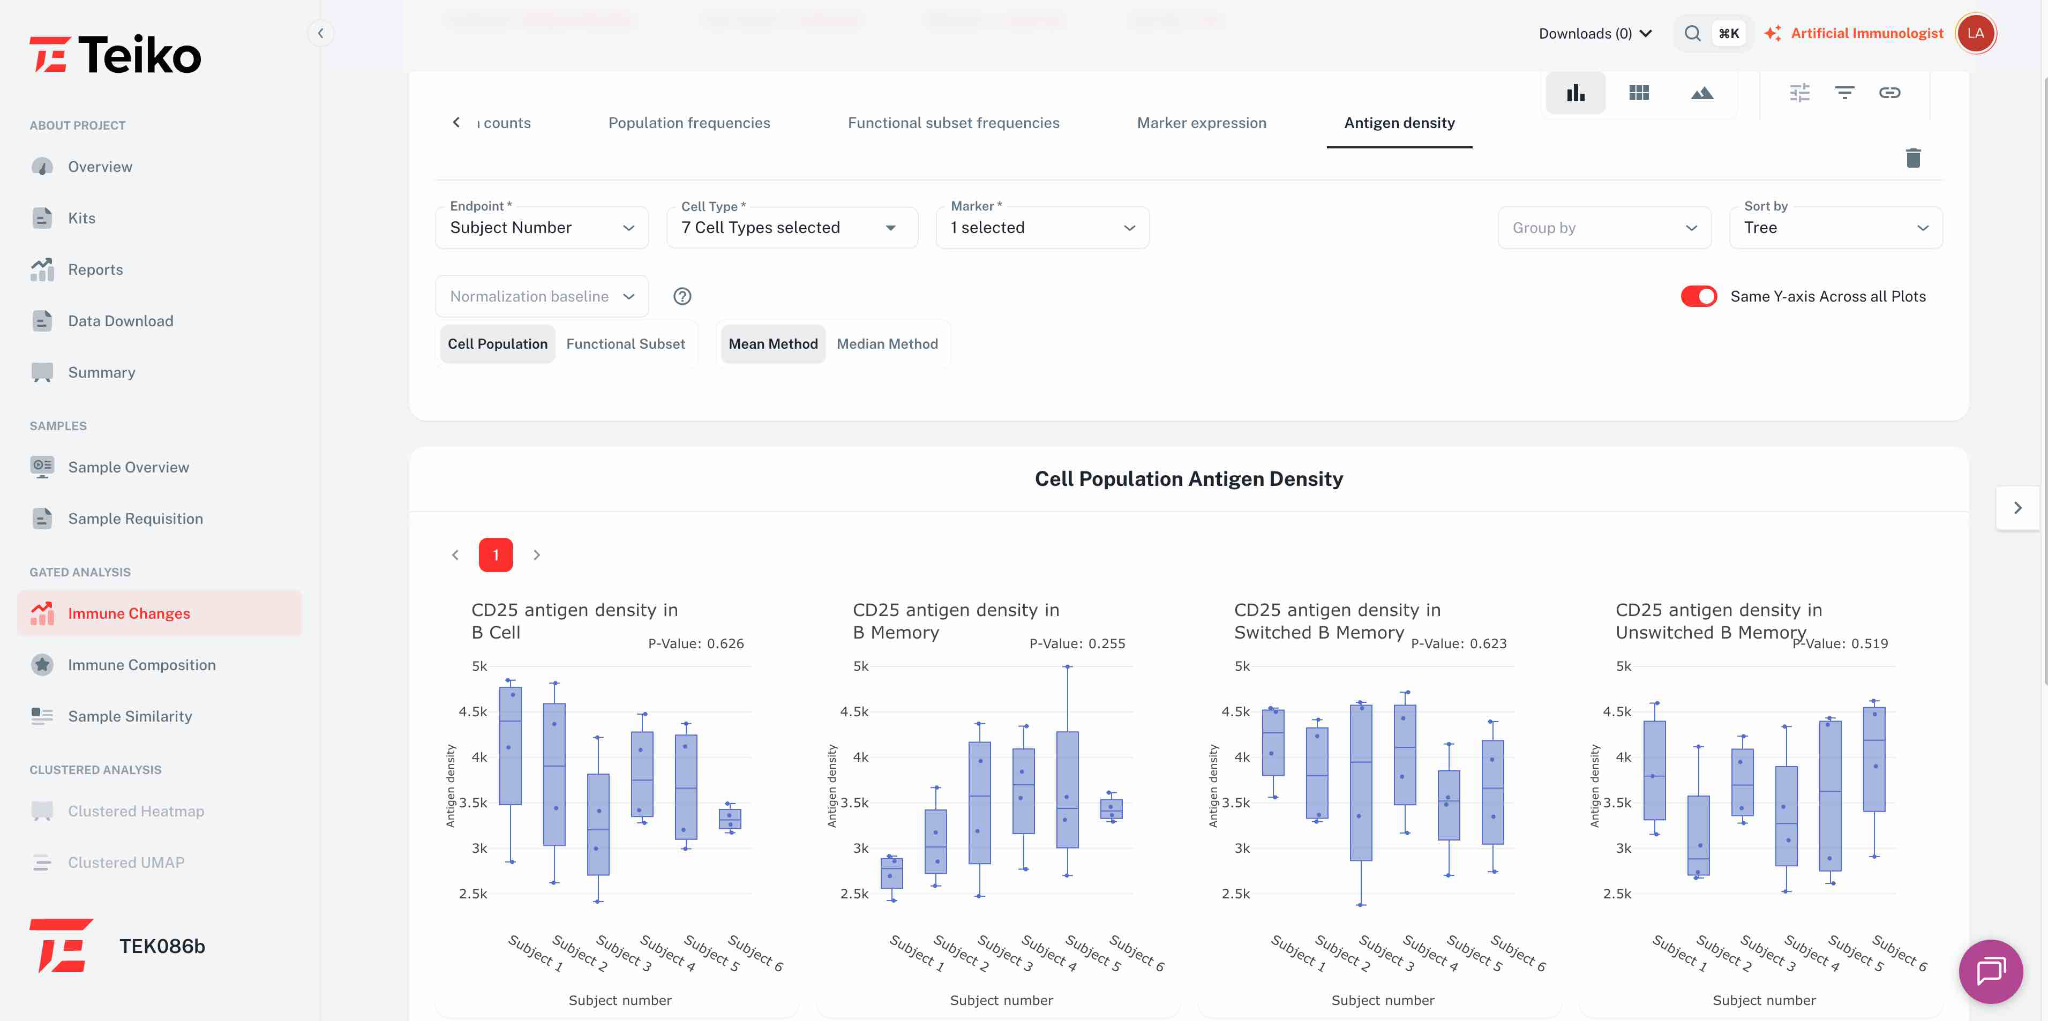
A new ‘Antigen density’ tab is now available on the TokuProfile project dashboard. For any density-quantified marker, researchers can view per-cell antigen density across every profiled immune population. Antigen density is reported in antibodies bound per cell (ABC), calculated from cytometry signal intensity against a standard curve of quant bead standards run alongside the assay. Three visualization types are included:
Three visualization types are included:
Plots work with the same filtering, grouping, sorting, and export workflows available across the rest of the dashboard.
Measuring antigen density, the absolute number of target molecules per cell, helps drug developers define therapeutic efficacy, establish safety thresholds to avoid off-target toxicity, and optimize drug design. Surfacing these visualizations directly in TokuProfile Dashboard means translational teams can interpret antigen-level signals alongside frequency and marker expression results without leaving the project view.
Available now on TokuProfile Dashboard for projects where antigen quantification was performed. Navigate to any eligible project and select the ‘Antigen density’ tab.


.png)