Track phosphorylation signaling in your clinical samples
Start with Teiko's validated panels and add custom markers to measure target engagement, pathway activation, and pharmacodynamic response. Track phospho-signaling directly with readouts like pSTAT3, pERK1/2, and pS6.
The process
Select target phospho markers
Run each sample on a fit-for-purpose cytometry panel that can profile your desired immune cell populations.
Add custom phospho markers
Design a fit-for-purpose panel around your specific target, pathway, or mechanism of action.
View your results
Get reproducible pharmacodynamic insights without building and validating a panel yourself.
PhosphoFlow panel development
From selecting targets to a validated phospho flow panel.
Define targets and sample type
Identify the phospho markers to include and decide whether the panel will be built for whole blood or PBMCs.
Select clones and run titrations
Choose the antibody clones and reagents needed, then test concentrations to determine the staining conditions that give the best signal quality.
Permeabilization conditions
Test permeabilization conditions to get clean signal with strong cell recovery.
Stimulation conditions
Compare stimulated and unstimulated samples.
Panel and readout strategy
Bring the validated markers and conditions together into a finished panel and define how the data will be displayed and interpreted.
Check out our assay validation report →Measuring STAT3 and pSTAT3 in a TokuKit-fixed blood sample
STAT3 is phosphorylated when a cell is actively signaling. At that point, STAT3 becomes pSTAT3. By stimulating with IL-6, we activate the pathway, providing a signal for detection. We then use TokuKit to stabilize the signal and measure pSTAT3 levels. When creating your fit-for-purpose panel, we apply this method for each marker, identifying the appropriate stimulation conditions required to activate each one.
- Prepare IL-6.
- Collect whole blood into a vacutainer.
- Stimulate with IL-6, incubate 15 minutes at 37°C.
- Fix sample with TokuKit: move blood into Buffer 1 for 15 minutes, then transfer the entire mixture into Buffer 2.
- Store fixed samples at −80°C until analysis.
Capture phospho state at collection to prevent degradation. TokuKit fixes samples at the point of collection, locking in the phospho proteins before shipping or processing can change them, so they are ready for cytometry analysis. Check out our TokuKit validation studies on mass and spectral, including a list of 120+ validated markers and clones.
See validated markers and stability data →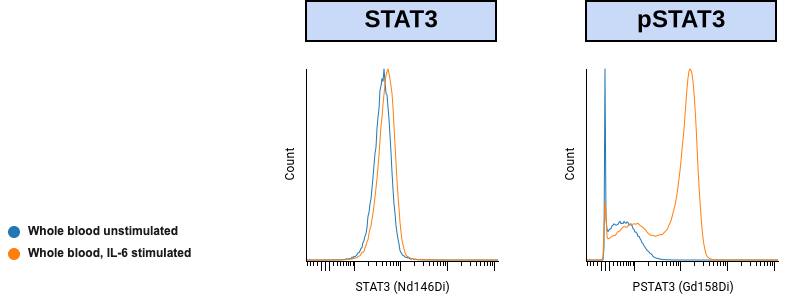
STAT3 and pSTAT3 histogram overlays: unstimulated vs. IL-6 stimulated whole blood, TokuKit-fixed
.png)
pSTAT3+ gating: total STAT3 is unchanged, pSTAT3 increases with IL-6 stimulation
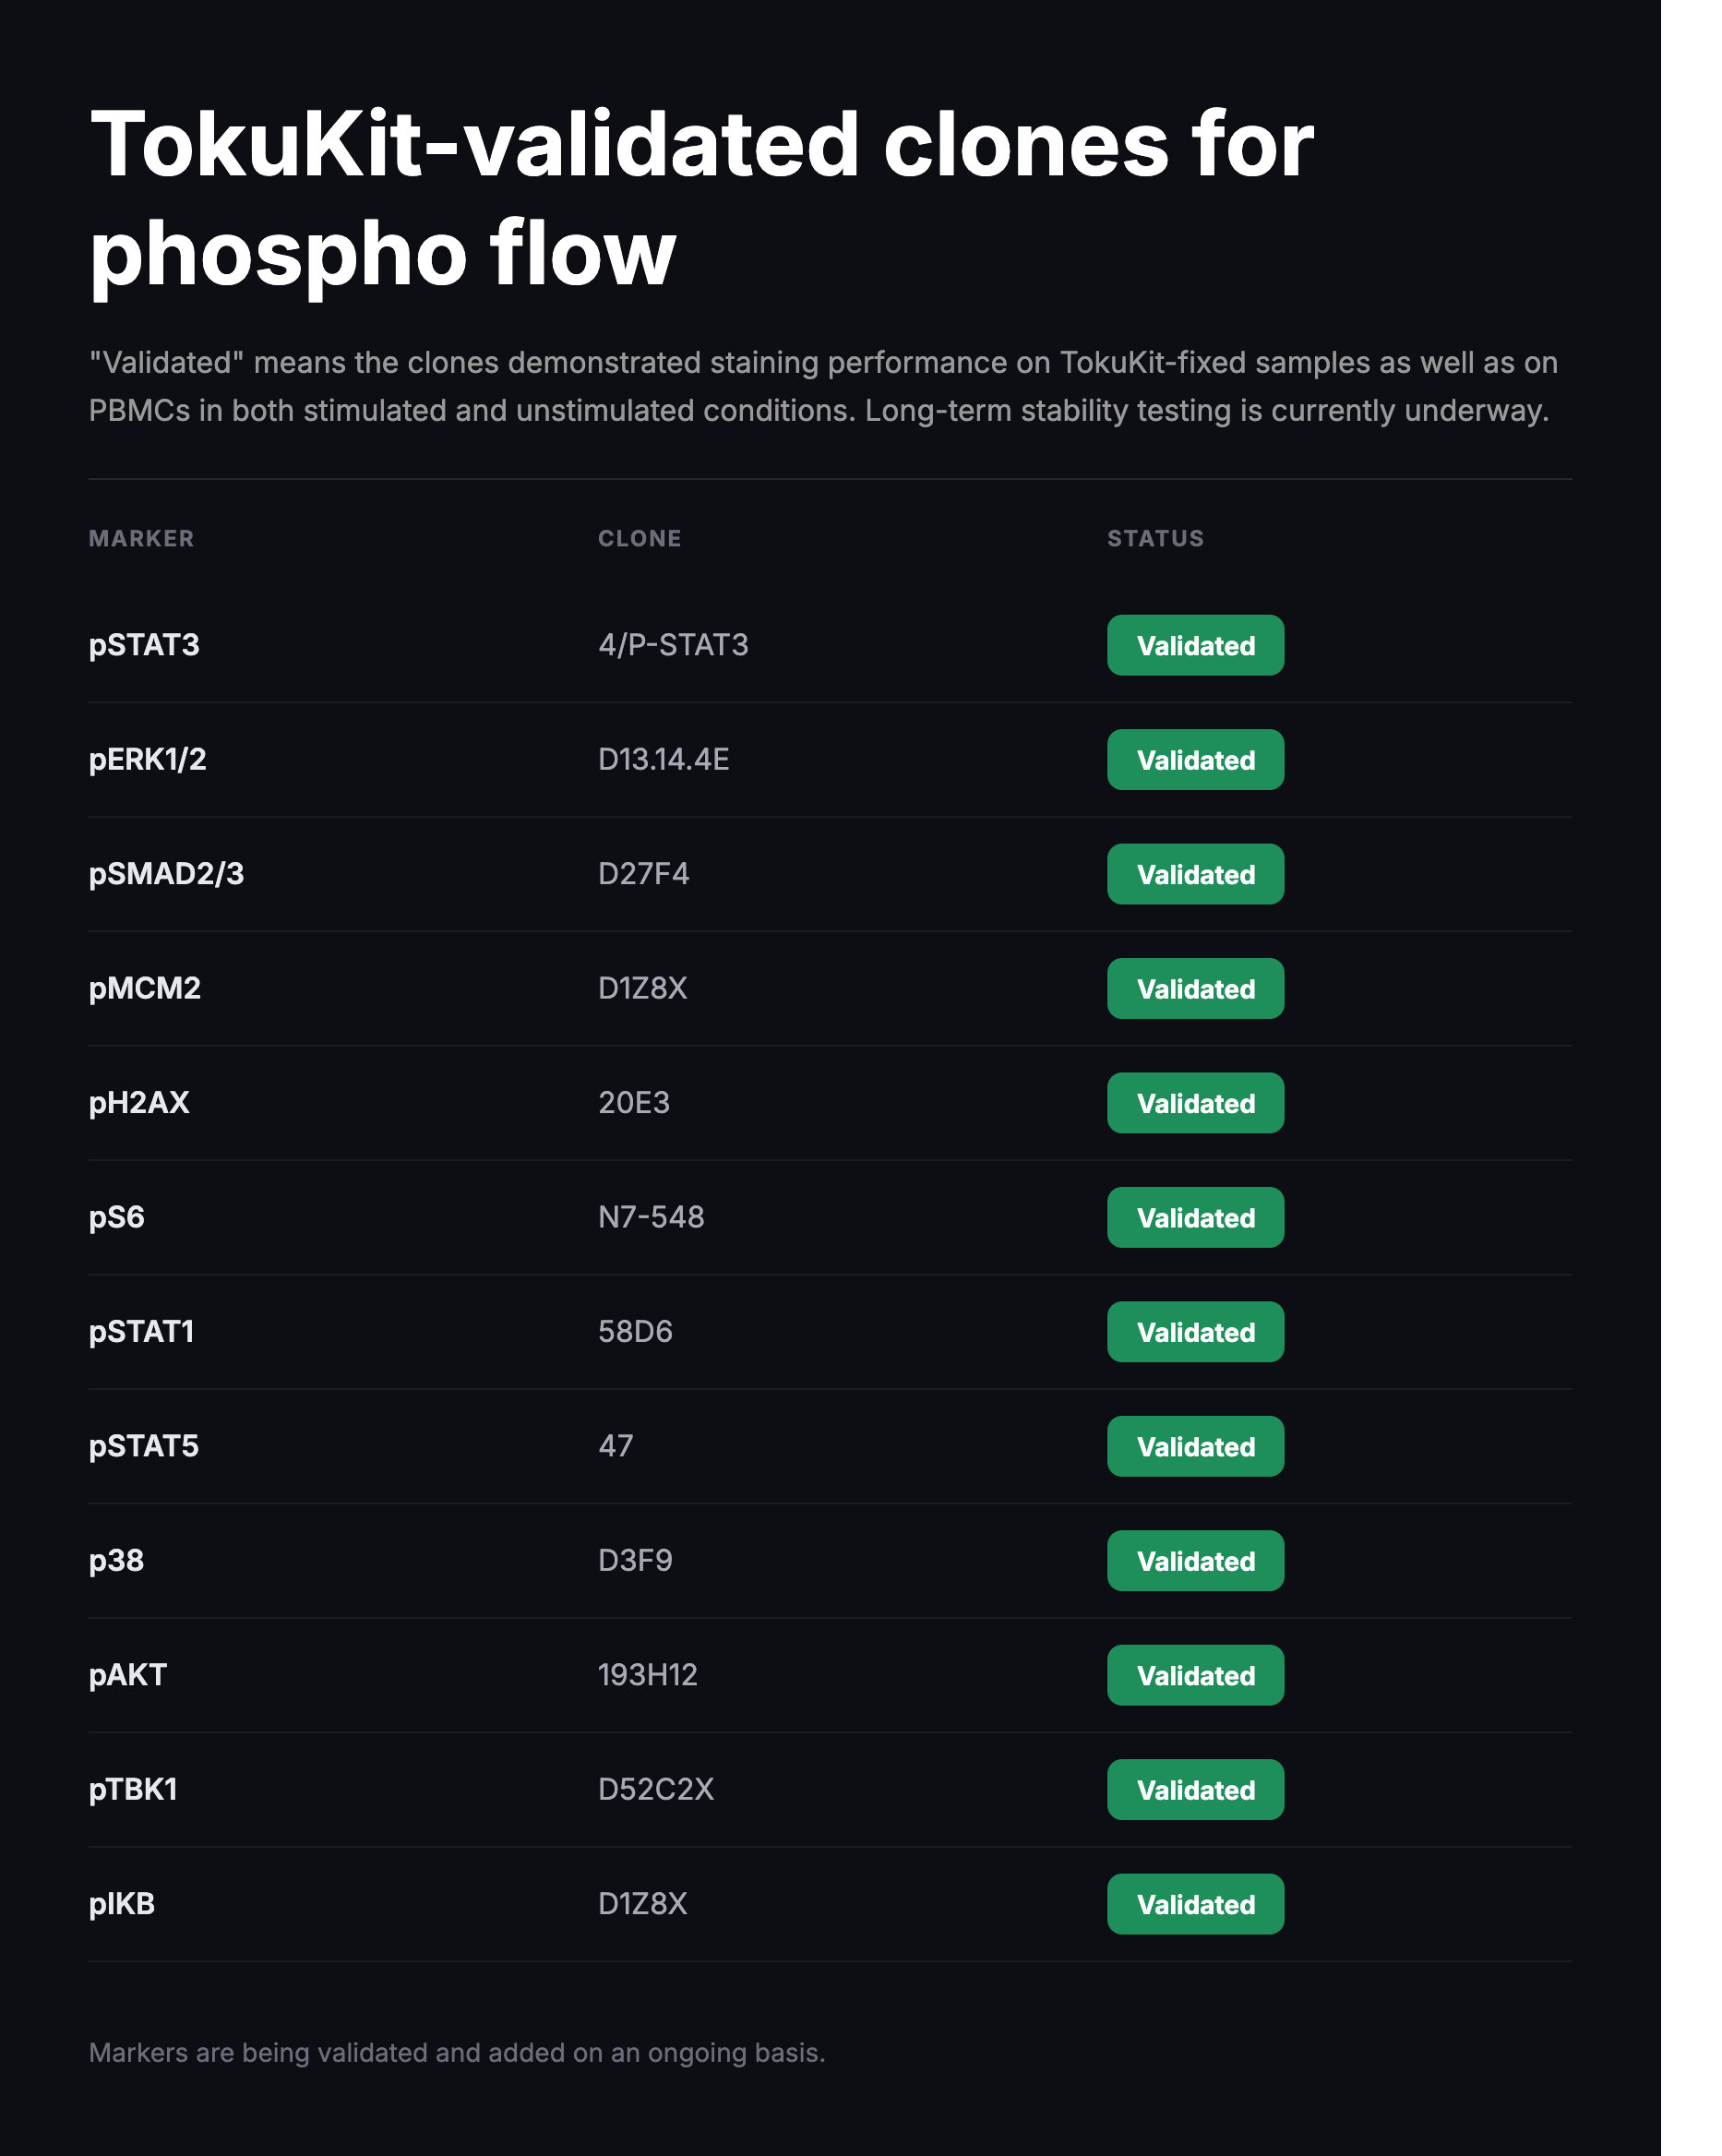
TokuKit-validated clones for phospho flow
Visualize immune changes across markers, populations, and drugs
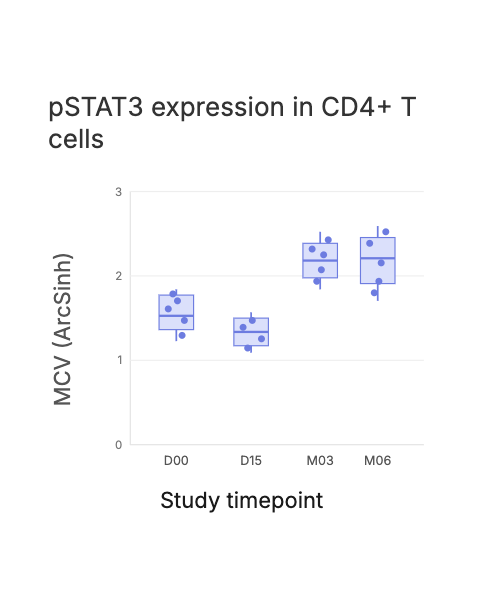
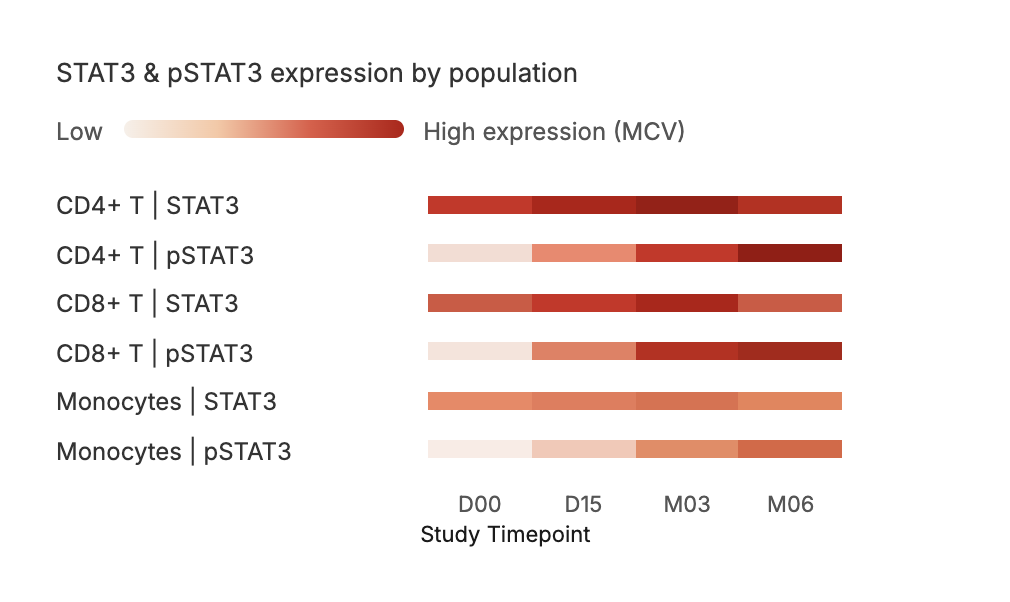
Once your panel is built, we run your samples and track total and phospho protein levels across your study endpoints. Timepoints shown here are one example, all visualized on your dashboard, interactive and shareable.
pSTAT3 by timepoint
CD4+ T cell pSTAT3 signal across a study, one box per timepoint.
pSTAT3 marker expression heatmap
Median channel value (MCV) for each marker on each cell type. Higher values indicate stronger expression.
Phospho flow informs clinical decisions
Phospho flow supports many translational, biomarker, and clinical questions. Here are three ways teams put it to work.
Predict treatment response
Comparing pathway activation before and after treatment gives an early signal of who is and is not responding, well before clinical outcomes play out.
Screen mechanism of action
By measuring the exact signaling step a drug is meant to block, you can confirm it is working as intended and compare candidate compounds side by side.
Track disease status
Changes in phospho signal can track disease status over time, giving a clear readout of whether a patient is moving toward remission.
Frequently asked
Ready to develop your phospho flow assay?
Share the markers you are interested in, and we will take it from there, delivering you the right custom panel.