Everything you need to move an assay from design into clinical samples, fully documented.
Assay development
A fit for purpose assay measures the drug's actual mechanism, capturing the target, its downstream markers, and the specific cell states that define response.
This stage is completed with a Panel Performance Report with in-depth analysis of multi-point titration, recommendations on a staining concentration, gating scheme and final panel configuration.
Assay qualification
Assay qualification demonstrates that the assay performs reliably enough to support the decisions the trial data will drive, defining the limits of the assay before patient samples are ever run.
Study 1 · Deliverables
Stability
A stability study defines how long a sample holds its immune signal from baseline, tracking population frequencies and marker expression over days, weeks, or months, to find where the signal degrades. The stability window establishes the processing window that sites and CROs have to work within before the immune data is no longer reflective of the patient's true clinical state.
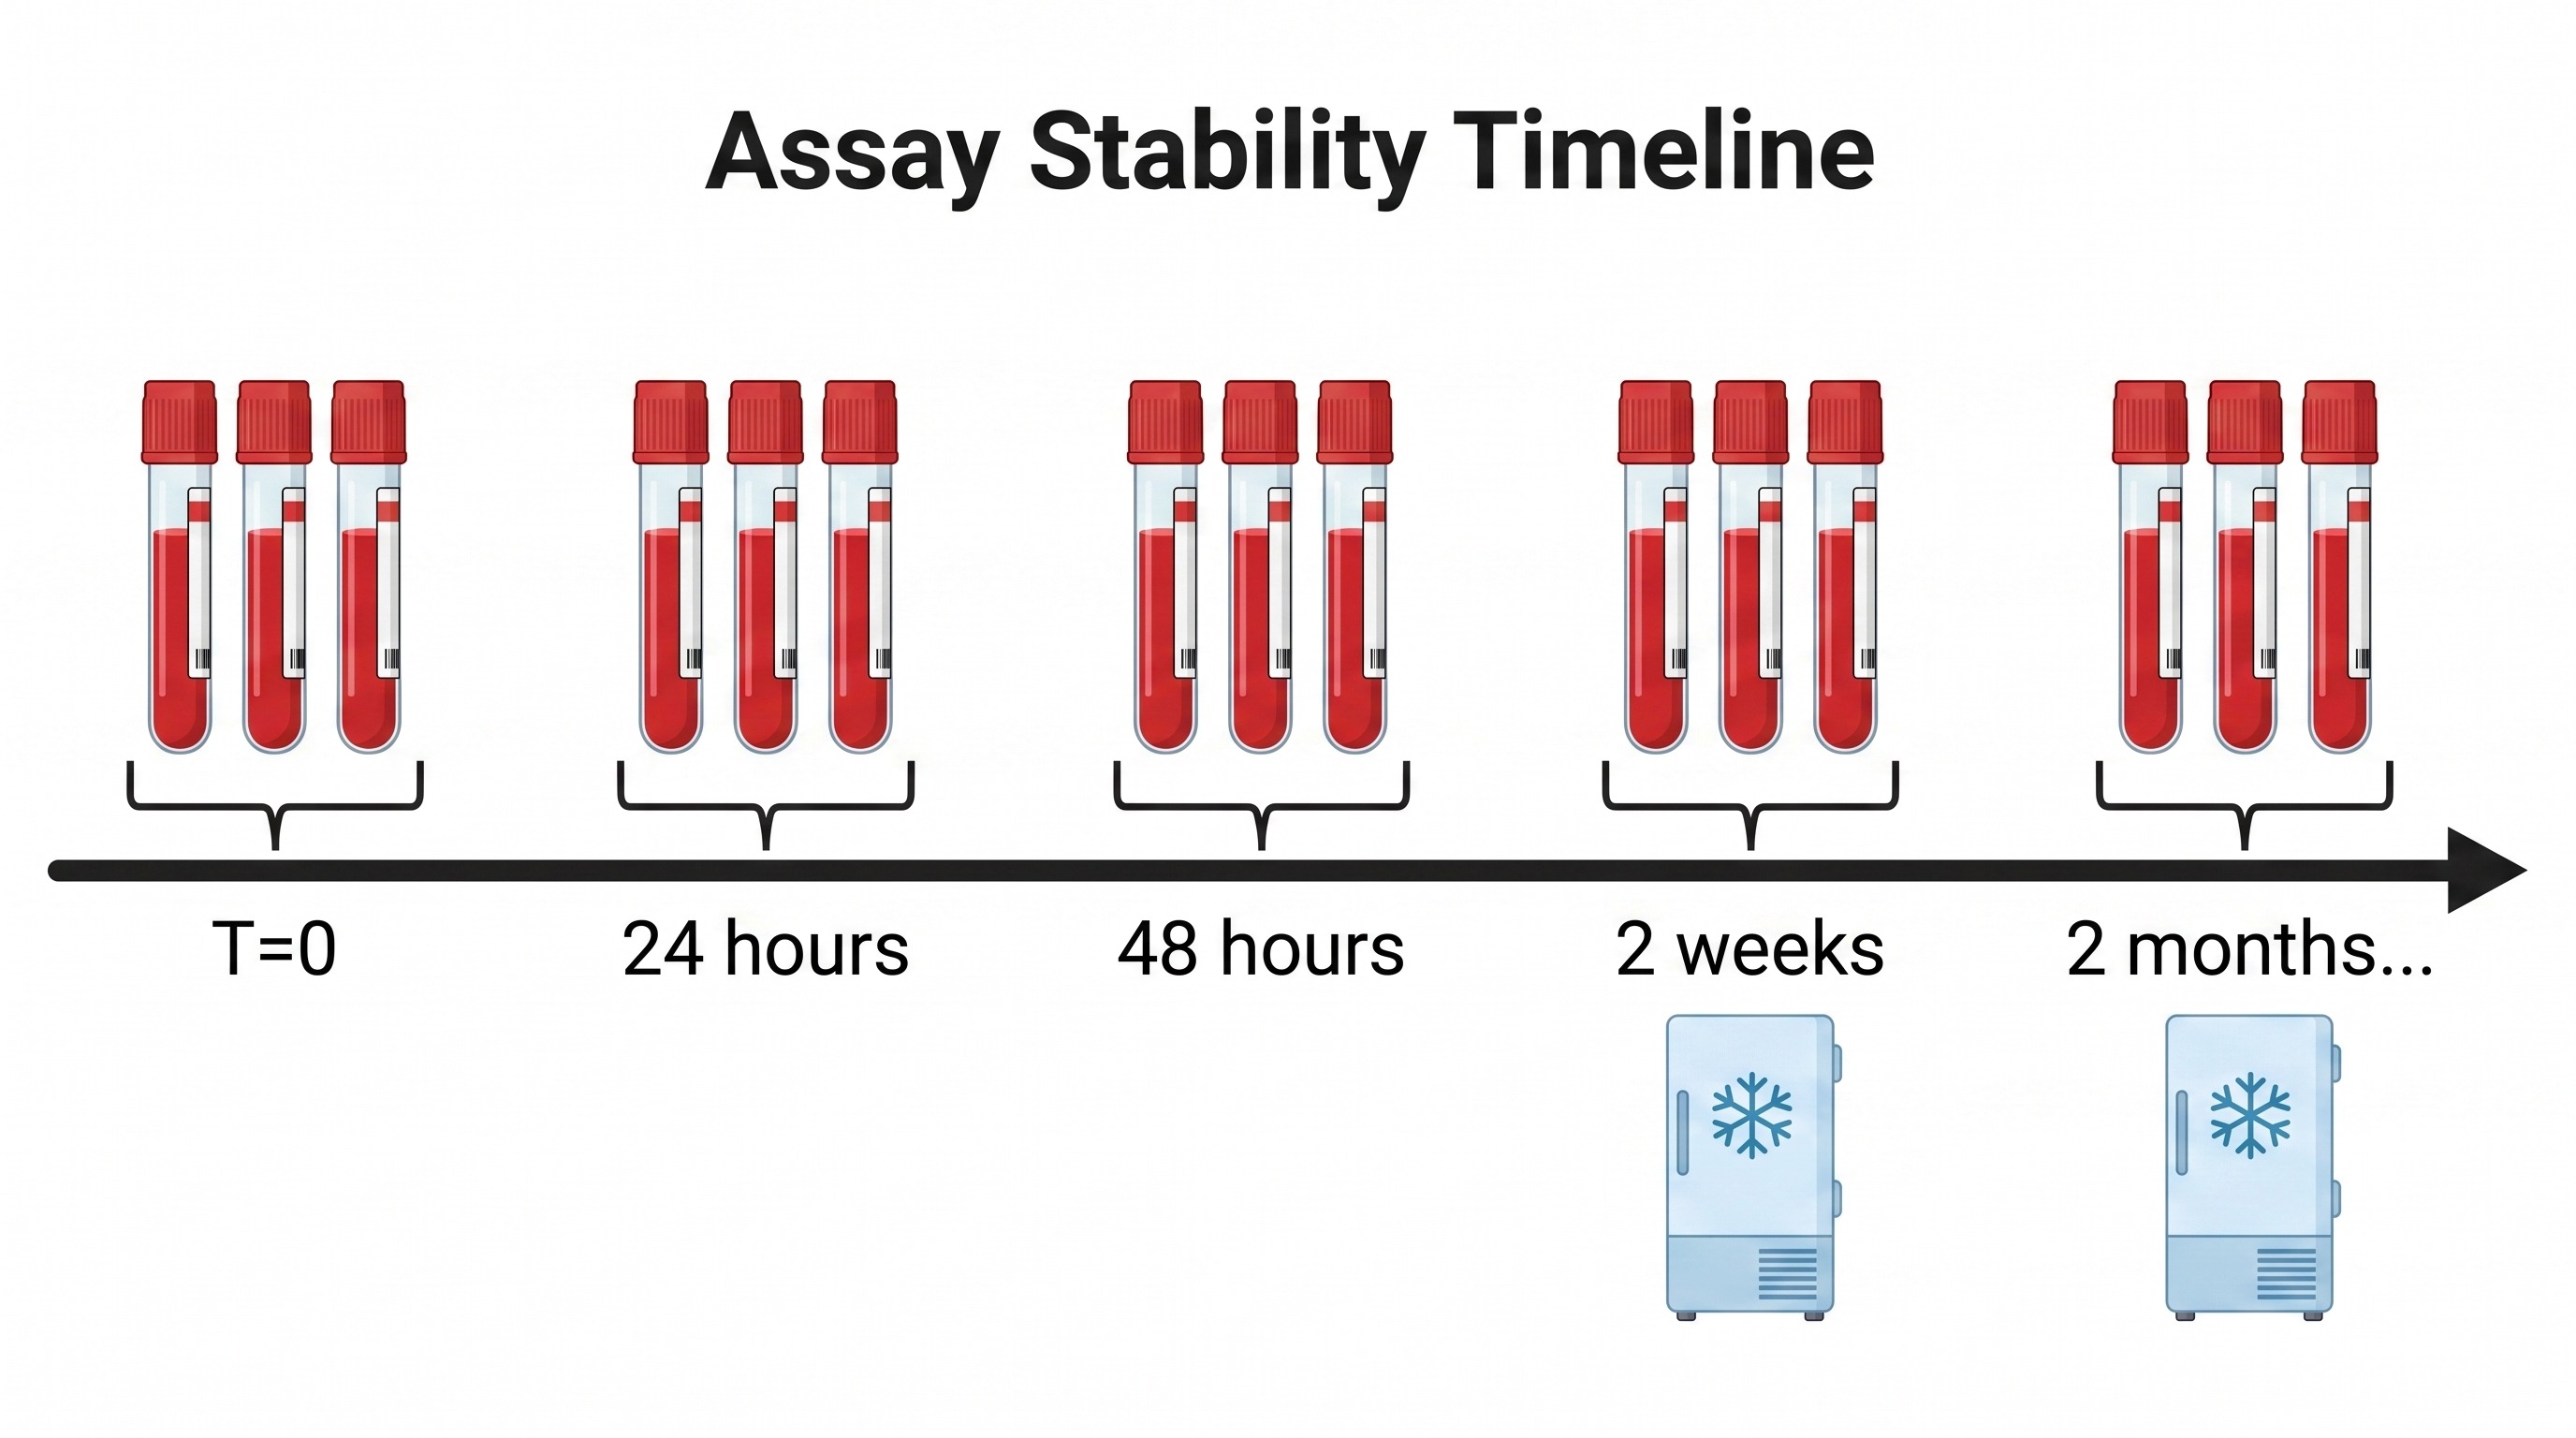
Multiple specimens held across timepoints.
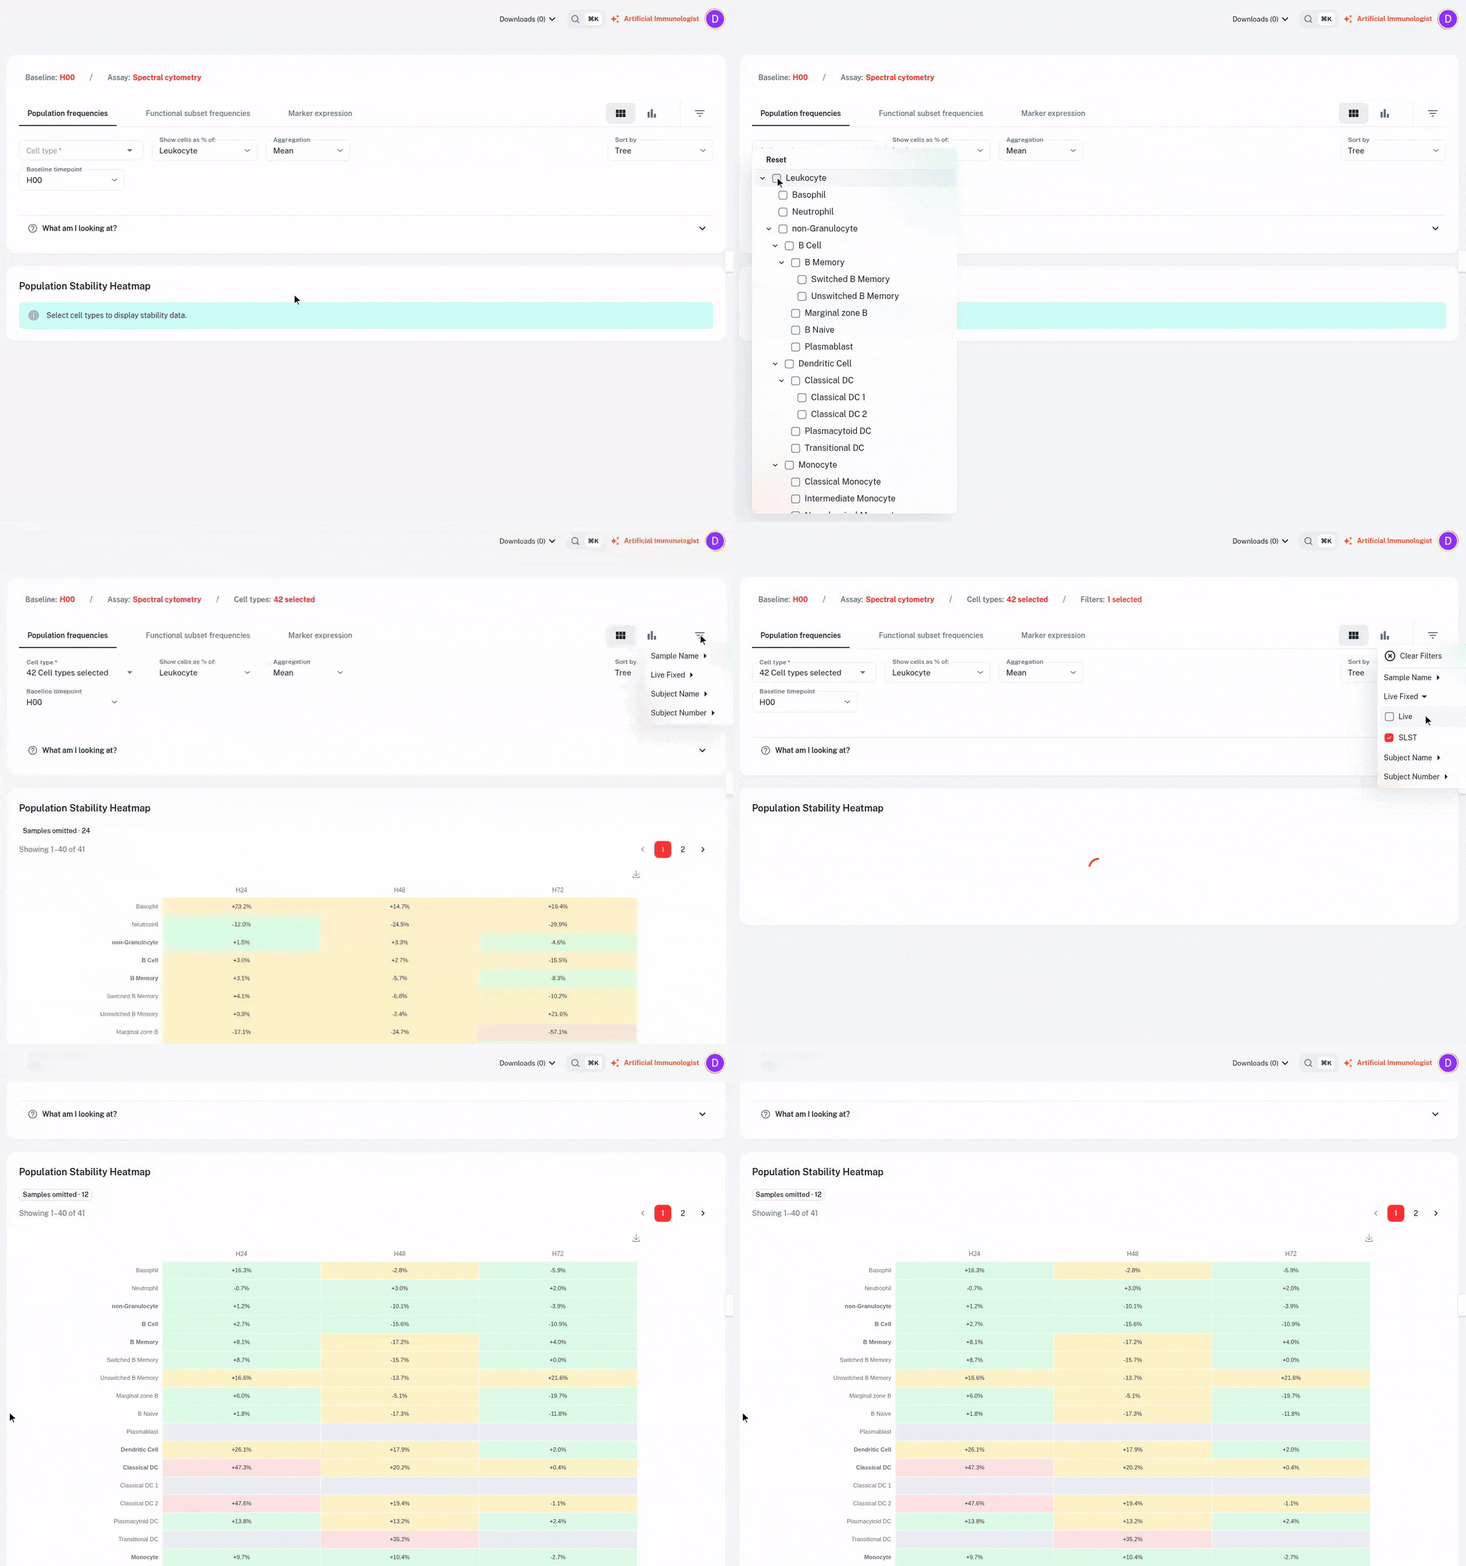
Population stability heatmap · percent difference from baseline per timepoint
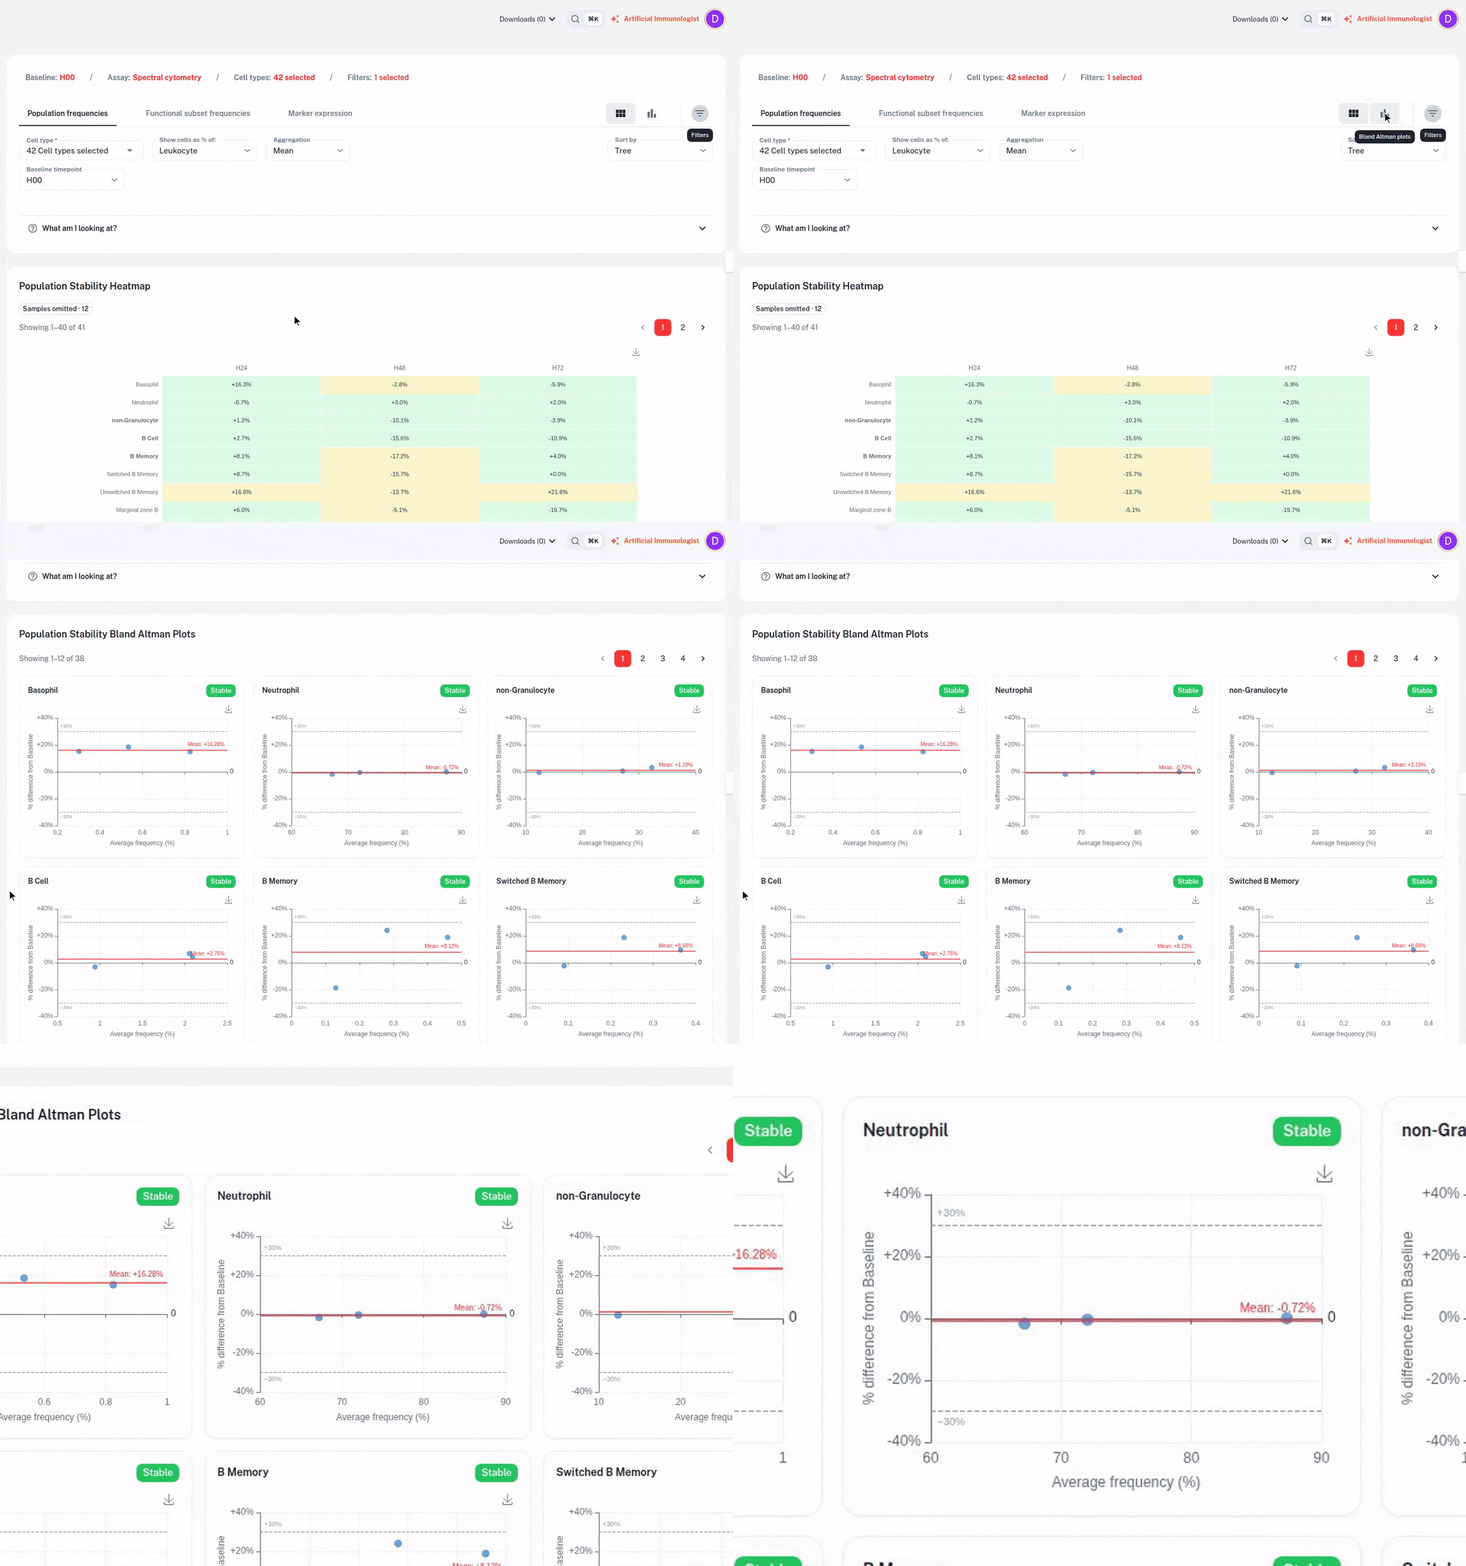
Each population is classified using limits of agreement of ±30%. Stable: the mean and every subject are within ±30%. Moderate: the mean is within ±30%, but one or more subjects exceed it. Variable: the mean itself exceeds ±30%.
Study 2 · Deliverables
Precision
A precision study establishes the intra- and inter-run variance of the workflow, so a change measured in a patient can be separated from the noise of the assay itself. It sets the threshold for what counts as a real biological shift.
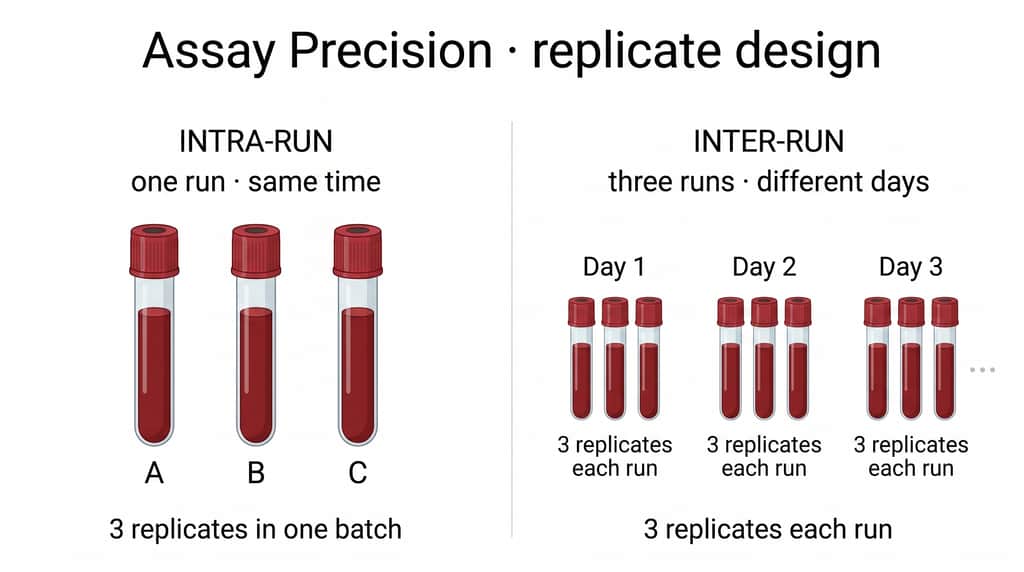
Intra-run vs inter-run replicates. The percent CVs between replicates in the intra- and inter-run tests are calculated as % CV = (Standard Deviation / Mean) × 100, where the standard deviation and mean are calculated across the three replicates for each test.
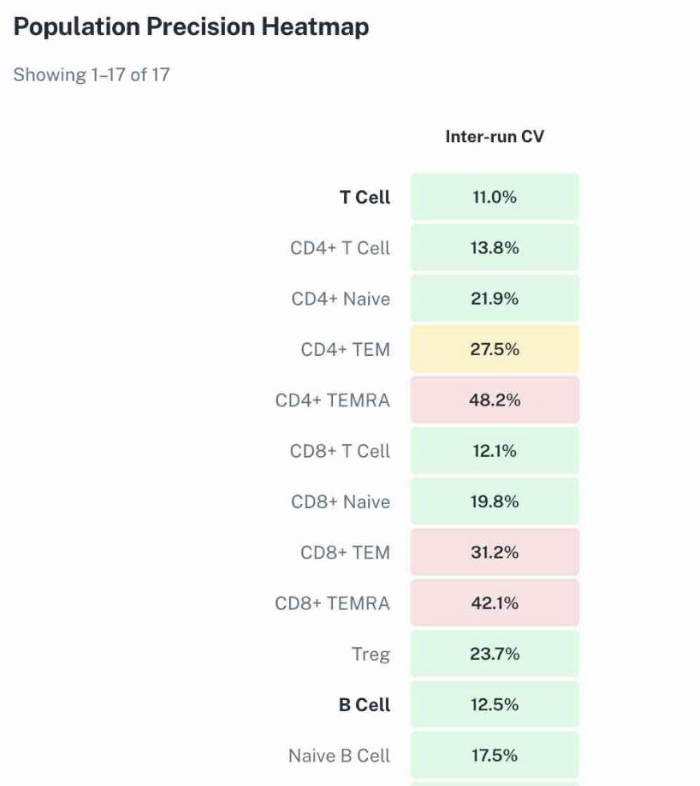
Population precision heatmap · inter-run CV per population
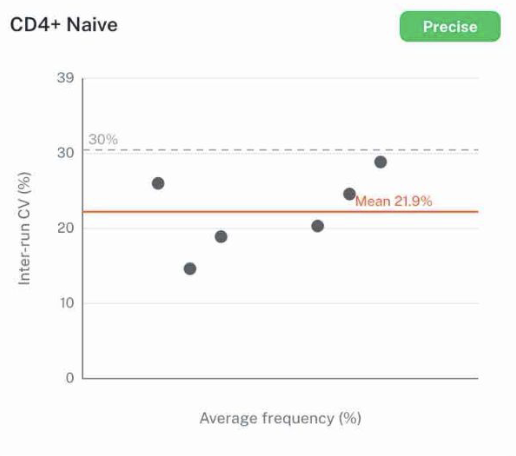
Bland-Altman, run vs run · one plot per population
End of study
Assay Qualification Report
Assay Stability and Precision Qualifications each include an end of study Assay Qualification Report. A report summarizing the qualification study, including:
- Executive summary outlining the study objective, scope, and conclusion of the qualification.
- Compliance statement referencing applicable Teiko SOPs and quality standards followed during the study.
- Purpose, Scope, and Acronyms
- Description of the 40-marker human phospho mass cytometry, including assay overview, antibody clones, lots, vendor, and stocks and staining concentrations per antibody
- Materials and methods, detailing:
- Instruments
- Reagents
- Software
- Sample collection and processing method
- Samples staining and acquisition protocol
- Data analysis
- Qualification parameters, covering:
- Precision (% CV) and reference range evaluation
- Stability (% difference)
- Results section including:
- Gating strategy and schemes
- Precision assessment of phenotypic and functional marker immune cell population and subset frequencies, and of functional marker expression levels (MCV), for intra- and inter-run replicates.
- Stability assessment of phenotypic and functional marker immune cell population and subset frequencies, and of functional marker expression levels (MCV), for baseline and post-baseline samples.
- Summary and conclusion of the assay precision qualification report, restating the study's purpose and presenting the key precision findings.
- Appendices
- Raw data: FCS files and GatingML files
Clinical sample processing and analysis
Trial samples run on the qualified assay, gated and reviewed per sample, then delivered as plots you can read and files biostats can use.
Deliverable
Panel Verification Report
Each antibody in the panel is verified on control samples before the antibody staining cocktail is made, so any underperforming clone is caught and replaced before study samples are run. The report captures the staining performance of each marker along with any substitutions.
Includes in the Panel Verification Report, per antibody:
- Channel
- Marker
- Antibody [Clone]
- Antibody Vendor
- Stock Concentration
- Staining Concentration
- QC Pass/Fail — For each antibody in the panel, the following metrics will be evaluated to determine acceptance for inclusion:
- Staining index and/or signal-to-noise ratio for each concentration of the antibody titration
- Spillover (as frequency) into nearby fluorochrome channels
- Frequencies displayed as dot plot or histogram of positive and negative populations
- Full gating strategy for tested samples
Method
Gating
Immune cell populations and subsets will be manually gated from each sample. Immune cell population frequencies will be calculated as follows:
- For non-granulocyte populations: as a percent of total non-granulocytes (‘cell population,’ ex. CD4+ T Central Memory Cells of total non-granulocytes)
- For granulocyte populations: as a percent of total leukocytes (‘cell population,’ ex. Neutrophils of total leukocytes)
Immune cell functional marker subset frequencies will be calculated as follows:
- For functional marker subsets: as a percent of parent cell population (‘cell functional subset,’ ex. PD-1+ cells of CD4+ T Central Memory Cells).
Marker expression will be calculated as the median fluorescence intensity (MFI) in the marker-positive cell populations (ex. MFI of PD-1 in PD-1+ CD4+ T Central Memory T Cells) and parent population (ex. MFI of PD-1 in CD4+ T Central Memory T Cells).
Deliverable
Statistics and Analyses
- Minimum of three samples per group required for statistical analysis. Fewer than three samples: plots will be provided, but no statistical comparisons will be performed.
- Statistical tests:
- Paired t-test for paired (within-subject) comparisons
- Mann–Whitney U-test for unpaired (between-group) comparisons
- Kruskal–Wallis test for multi-group comparisons
- Top 100 Statistics Table reporting the top 100 statistically significant comparisons for baseline timepoint and all-pairwise comparisons.
- Multiple testing correction using Benjamini-Hochberg False Discovery Rate (FDR) correction
- Principal Component Analysis (PCA)
- Volcano plot analysis
Deliverable
Plots and Graphs
- Box plots – Immune composition; Immune differences across endpoints
- Line charts – Immune composition; Immune differences across endpoints
- Stacked bar plots – Immune composition
- PCA plots
- Volcano plots
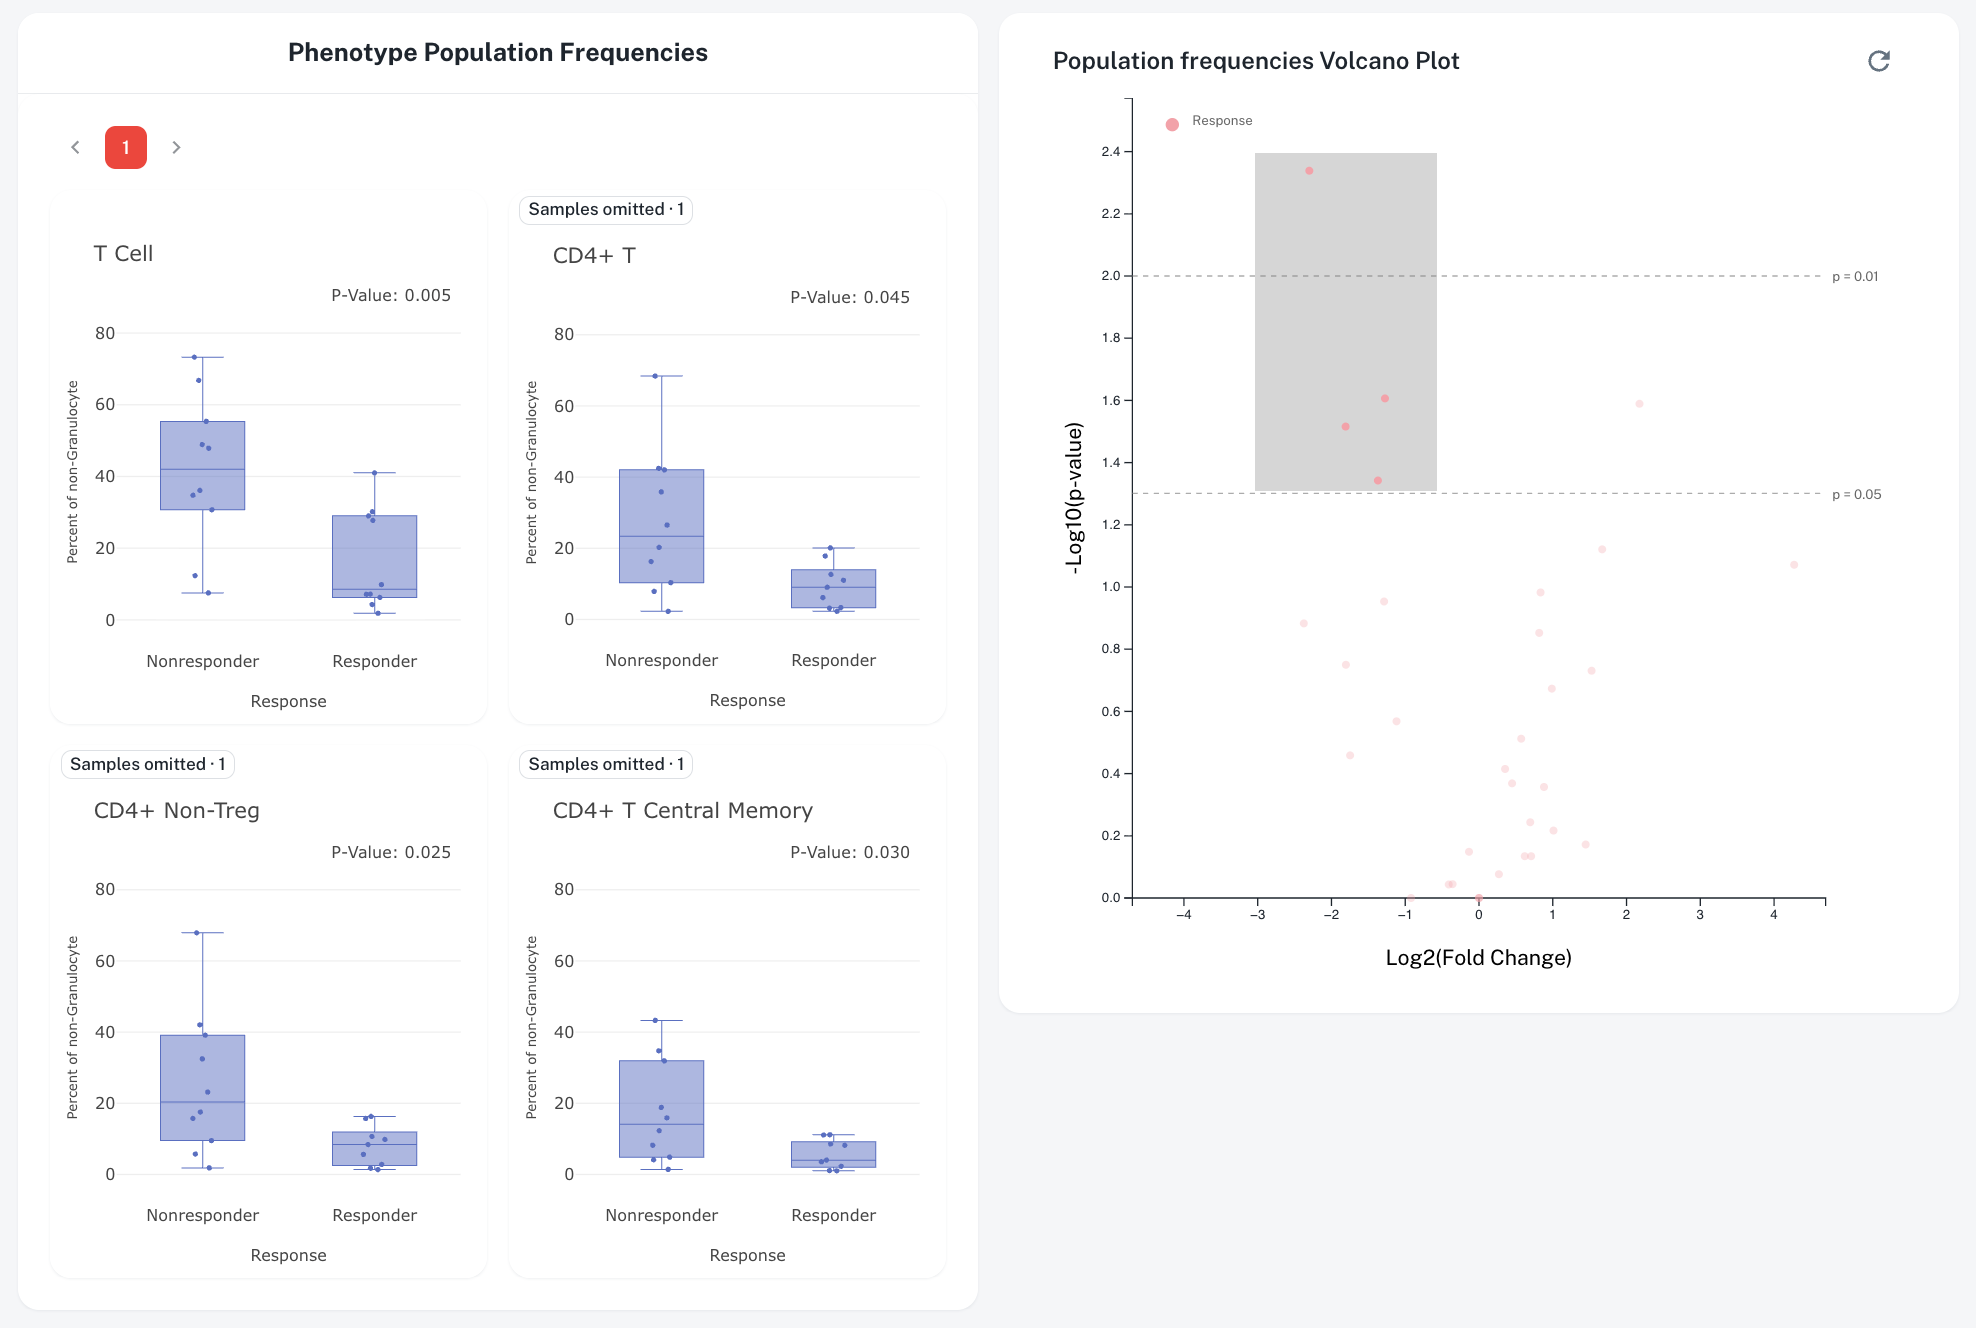
Box plots and volcano plot · population frequencies by response, with p-values
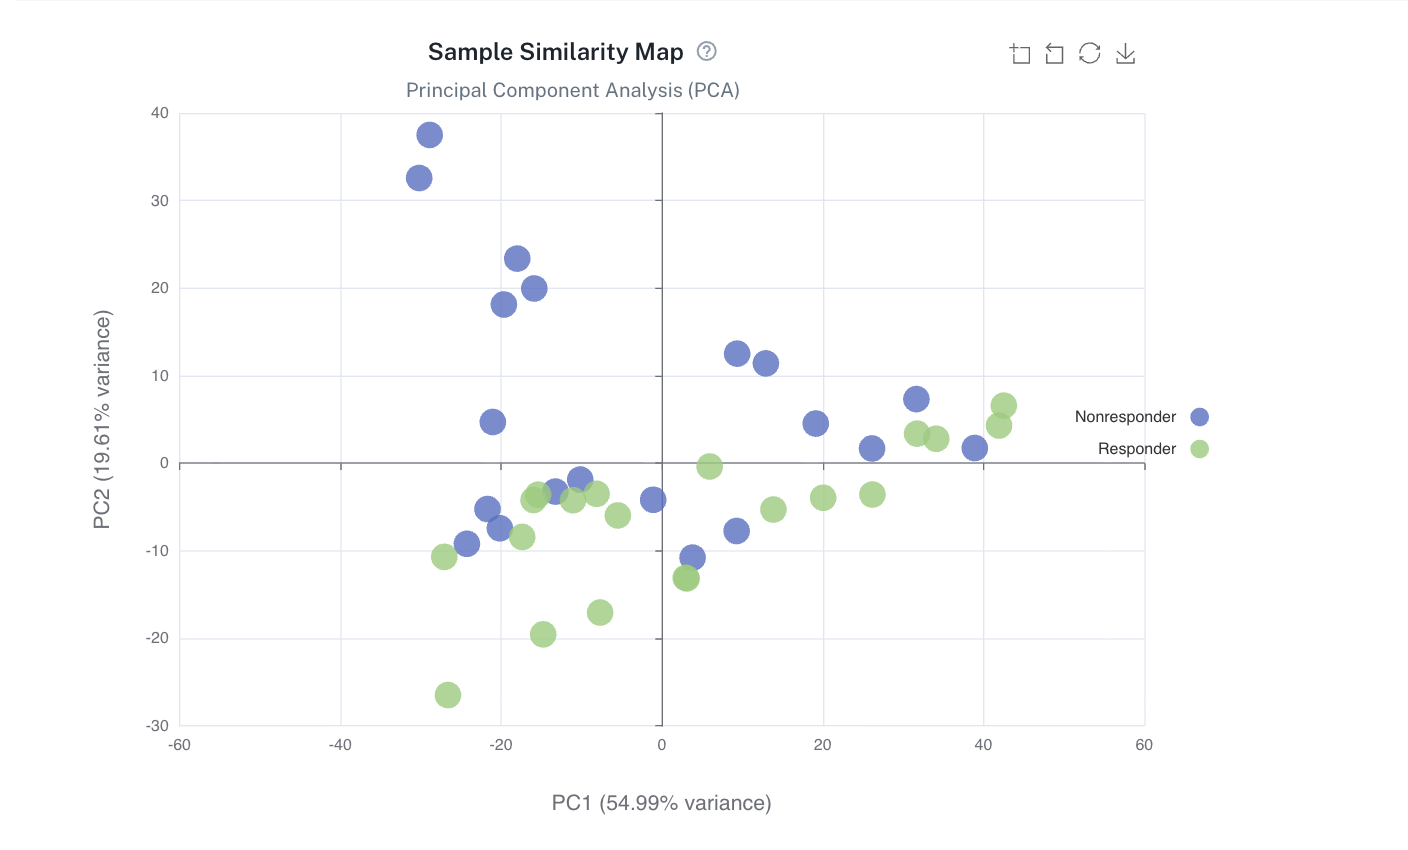
PCA plot · sample similarity map
Deliverable
Data Downloads
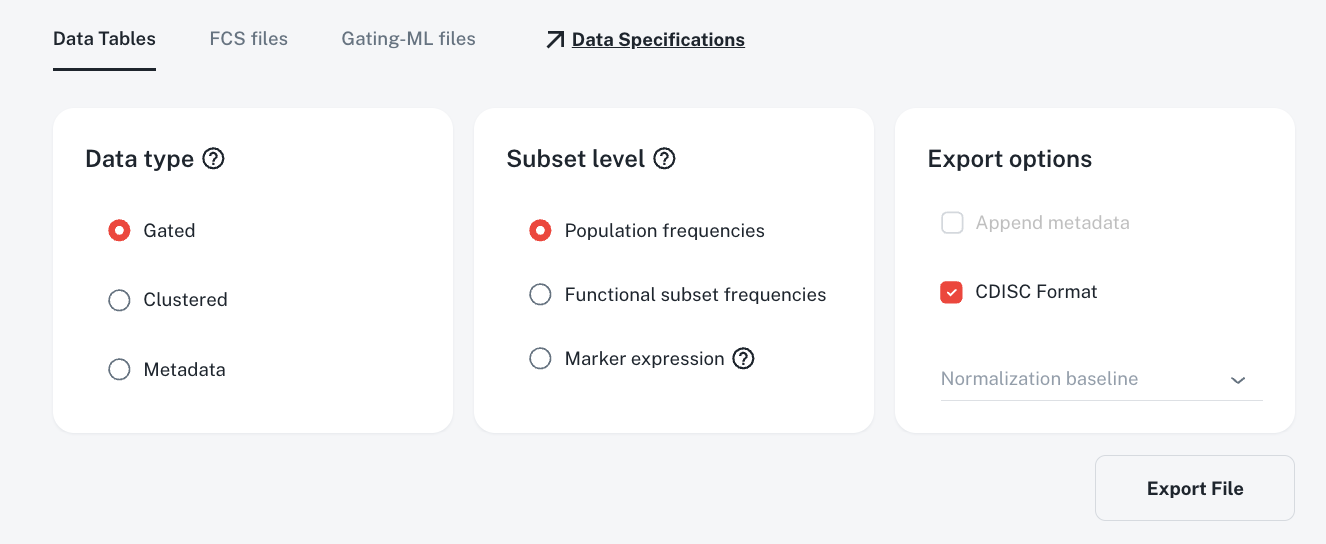
Exports · data tables, FCS files, Gating-ML files
Files:
- Flow Cytometry Standard (FCS) files
- Gating-ML files
Tables:
- Immune cell populations and functional marker subset frequencies
- Marker expression levels
Export formats:
- Appended metadata
- CDISC format
Where is your program today?
Developing the assay, qualifying it, or ready to run clinical samples. We'll meet you there.
Talk through your stage