Report immune cell frequencies across populations and subsets.
For your clinical trial, Teiko gates multi-parameter cytometry into the immune populations and functional subsets your protocol needs, then reports each as a frequency of each possible ancestor, not just its parent.
The process
Define the gating tree
Lock populations and subsets to your endpoints and comparison plan.
Run the qualified panel
TokuKit-fixed whole blood or PBMC on mass or spectral cytometry.
Review frequencies on the dashboard
Boxplots, group differences, and longitudinal change for every gate.
From panel to frequency tables.
Agree the gates once, then report % of parent consistently across subjects and visits.
Agree the analysis plan
Parent gates, children, and functional subsets tied to your endpoints.
Learn about panel development →Process specimens
Qualified workflow with documented precision and stability windows.
Gate consistently
Same tree applied across subjects and timepoints.
Report % of parent
Each population as a share of its defined parent.
Explore in the app
Immune Boxplot, Immune Differences, and Immune Changes Over Time.
What a frequency tells you.
A frequency answers: of this parent compartment, what share is this population? It is the right unit for composition, lineage balance, and many biomarker cutoffs. Pair frequencies with absolute counts when parent size itself may change under treatment. Pair with marker expression or antigen density when the question is how much target sits on the cells, not only how many cells are in the gate.
Frequency of parent
% of parent · composition and lineage balance
Illustrative figure placeholder from template; replace with frequency visuals later.
See frequencies with your data.
Compare cohorts and dose levels on every gated population. Follow each subject across visits. Export tables that match the gates in your statistical analysis plan.
Compare cohorts and dose levels
See how every gated population shifts across arms and groups.
.png)
Follow subjects across visits
Export tables that match the gates in your statistical analysis plan.
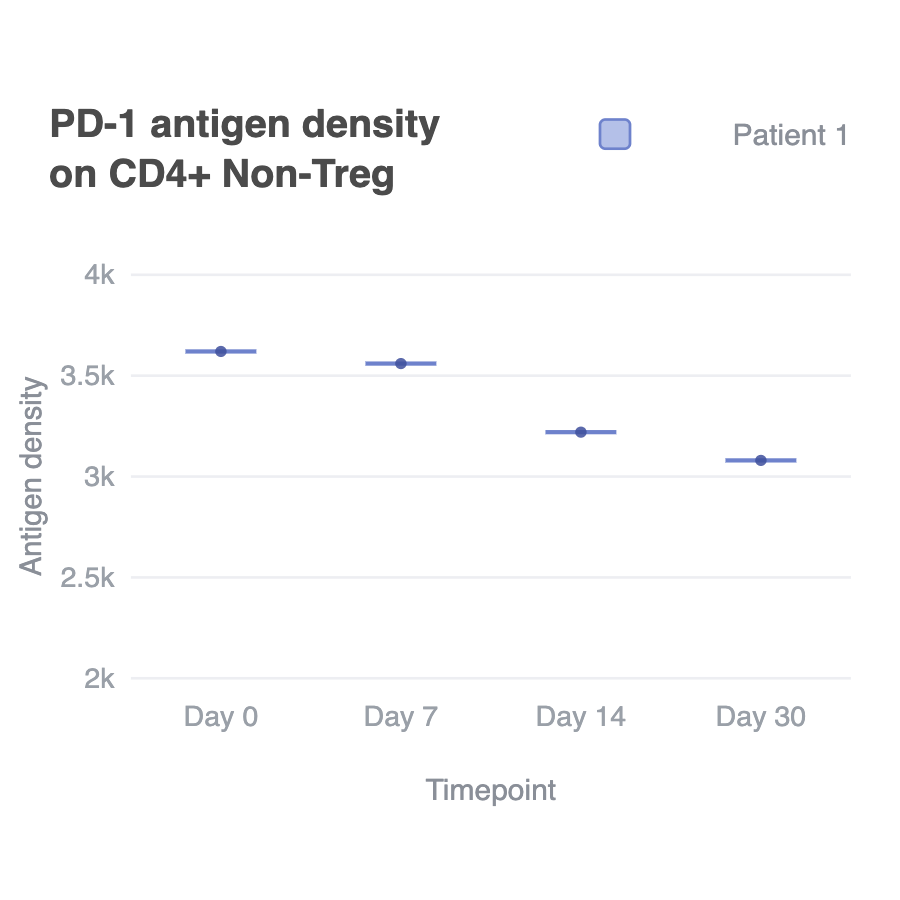
Frequencies reported as % of parent. Dashboard figure placeholders retained from template.
Explore the dashboard →Frequencies inform clinical decisions.
Immune cell frequencies support many translational questions. Here are three ways teams put them to work.
Map immune composition
See how lineages and subsets shift across arms and timepoints.
Support response biomarkers
Test frequency cutoffs against clinical outcomes.
Anchor companion metrics
Use the same gates for absolute counts, marker expression, and antigen density so every readout shares one tree.
Frequently asked
BasicsHow are parent gates defined?›
Details coming after science review.
MethodHow do frequencies relate to absolute counts?›
Details coming after science review.
PlatformCan frequencies share gates with marker expression?›
Details coming after science review.
PanelWhat sample types are supported?›
Details coming after science review.
SamplesHow are frequencies exported for stats plans?›
Details coming after science review.
Ready to lock frequencies to your trial endpoints?
Share your endpoints and comparison plan, and our scientists will help lock the gating tree with you.