Quantify absolute immune cell counts alongside frequencies.
For your clinical trial, Teiko reports cells per microliter for gated populations and functional subsets, not only relative frequencies. Pair your complete blood count (CBC) or contract research organization (CRO) white blood cell (WBC) data with TokuKit cytometry so treatment effects show up as real cell numbers.
The process
Collect two specimens
One for your CBC or CRO absolute count pathway, one for Teiko cytometry in TokuKit.
Share the WBC inputs
Provide specimen ID and WBC/µL (granulocytes, lymphocytes, monocytes optional).
View counts on the dashboard
See absolute counts next to frequencies for every gate and subset.
From dual specimens to cells per microliter.
Pair CBC or CRO absolute count inputs with TokuKit cytometry to report cells/µL on every gate.
Send the CBC or CRO specimen
Follow your lab’s instructions for the absolute count pathway.
Learn about TokuKit sample prep →Ship the cytometry specimen in TokuKit
Preserve and optimize the sample for multi-parameter cytometry.
Upload the WBC fields
Specimen ID and WBC/µL required. Granulocytes, lymphocytes, and monocytes optional.
Integrate into Teiko analysis
Teiko maps those inputs onto your gated populations.
Review absolute counts in the app
Immune Boxplot, Immune Differences, Immune Changes Over Time, and data tables all carry cells/µL.
Why relative frequencies alone can mislead.
Relative frequency is a share of a parent gate. When the parent expands or contracts, a stable drug target can look like it fell, and a rising population can look flat.
Comparison tables TBD
Relative frequencies (incorrect) vs absolute counts (correct) — tables TBD.
Placeholder: draft comparison tables not yet built into this layout (image/curve slot retained).
See absolute counts with your data.
A dedicated view reports cells per microliter for every profiled immune population, next to the relative frequencies you already use.
Immune Boxplot
Range, median, and spread of absolute counts per gate.
.png)
Immune Differences & Changes Over Time
Compare groups on absolute counts, and follow per-subject trajectories with timepoint comparisons.
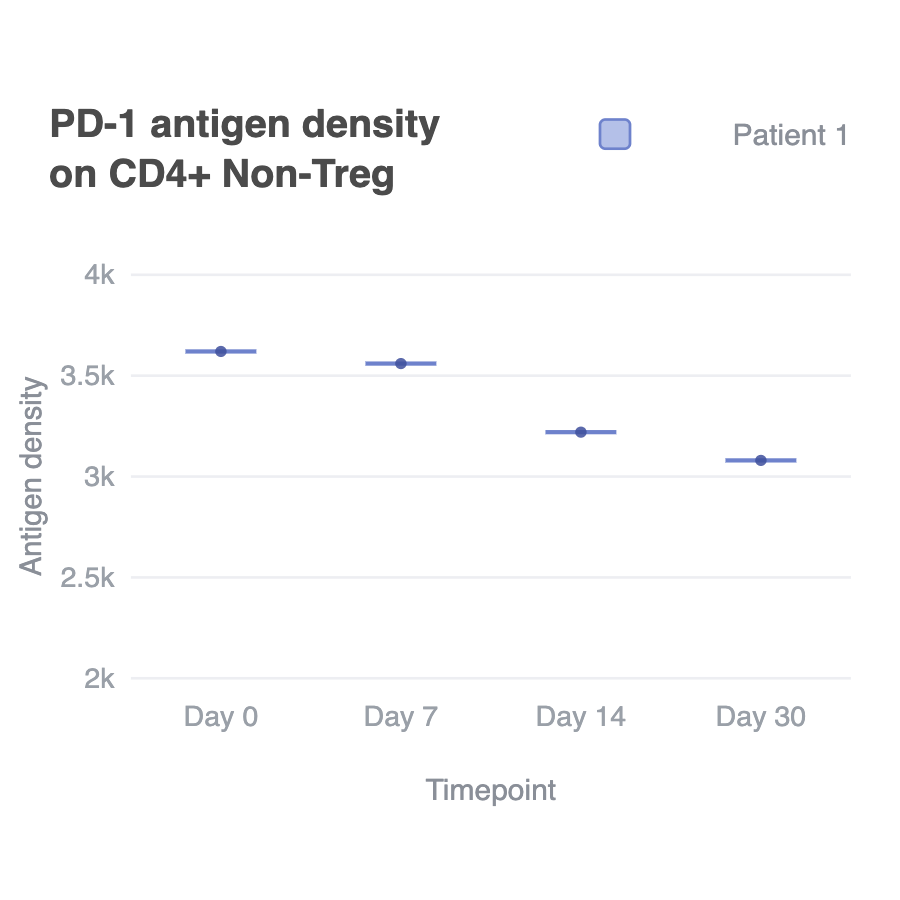
Absolute counts reported as cells/µL. Dashboard figure placeholders retained from template; replace with absolute-count visuals later.
Explore the dashboard →Absolute counts inform clinical decisions.
Absolute cell counts support many translational questions. Here are three ways teams put them to work.
Assess true treatment impact
Detect expansion or depletion even when percentages barely move.
Monitor immune recovery
Track reconstitution after lymphodepletion or cell therapy in cells/µL, not only shares of a parent.
Build stronger biomarkers
Correlate absolute counts with response, progression, or survival.
Ready to add absolute cell counts to your cytometry readout?
Share your trial design and sample plan, and our scientists will help add absolute counts alongside your frequency readout.