Measure marker expression across immune populations.
For your clinical trial, Teiko reports how strongly each gated population expresses the markers in your assay. Use expression to see activation, exhaustion, lineage identity, and treatment-driven shifts on the cells you already enumerate.
The process
Choose the markers
Snap targets into a Teiko backbone or CLIA assay.
Stain and acquire
Qualified mass or spectral cytometry workflow.
Review expression on the dashboard
Per population, per marker, across groups and time.
From assay to expression readouts.
Same gating tree as frequencies and absolute counts, with intensity summaries per marker.
Run qualified acquisition
Documented precision so small shifts are interpretable.
Gate populations
Same tree used for frequencies and absolute counts.
Summarize expression
Intensity metrics per marker within each population.
Compare in the app
Groups, visits, and subjects on one dashboard.
See marker expression with your data.
Track activation and exhaustion markers inside each population. Compare expression between responders and nonresponders. Follow expression trajectories for the same subjects over time.
Track activation and exhaustion markers
See how marker intensity differs inside each gated population.
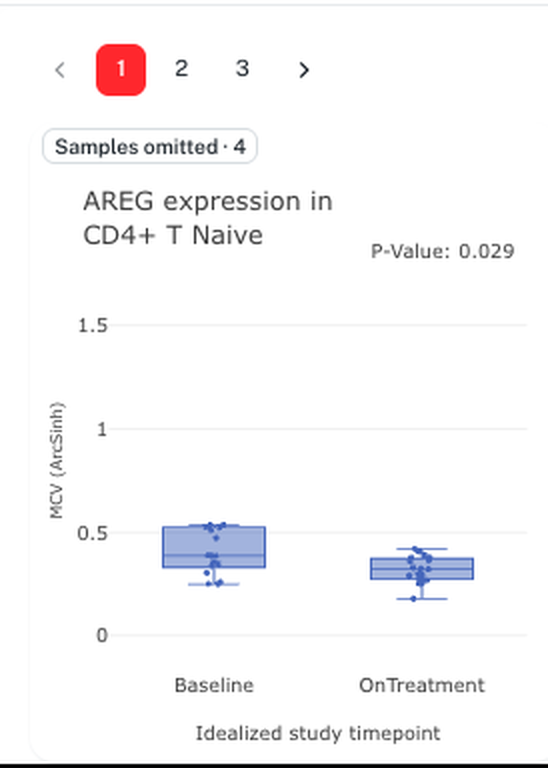
Compare groups and follow trajectories
Compare expression between responders and nonresponders, and follow the same subjects over time.
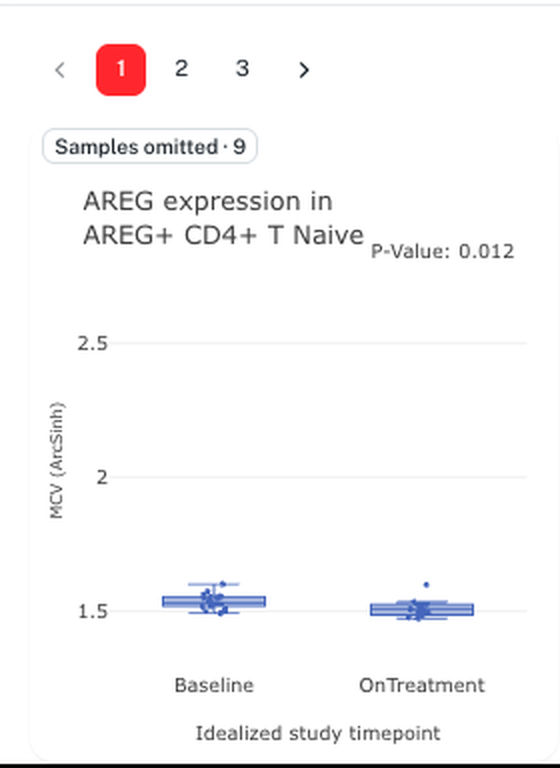
AREG expression boxplots from the Teiko dashboard (UMN002 demo): CD4+ T Naive and AREG+ CD4+ T Naive.
Explore the dashboard →Marker expression informs clinical decisions.
Marker expression supports many translational questions. Here are three ways teams put it to work.
Read cell state, not only cell number
Frequencies say who is present. Expression says how those cells look biologically.
Support MoA hypotheses
See whether treatment changes PD-1, activation, or lineage markers on the intended populations.
Bridge to antigen density
When a marker becomes a drug target question, graduate that marker to a calibrated density assay.
Ready to measure marker expression on your assay?
Share the markers and sample type you're working with, and our scientists will help design the right assay with you.