Cell Count Cutoff Now Available for Immune Changes Analysis
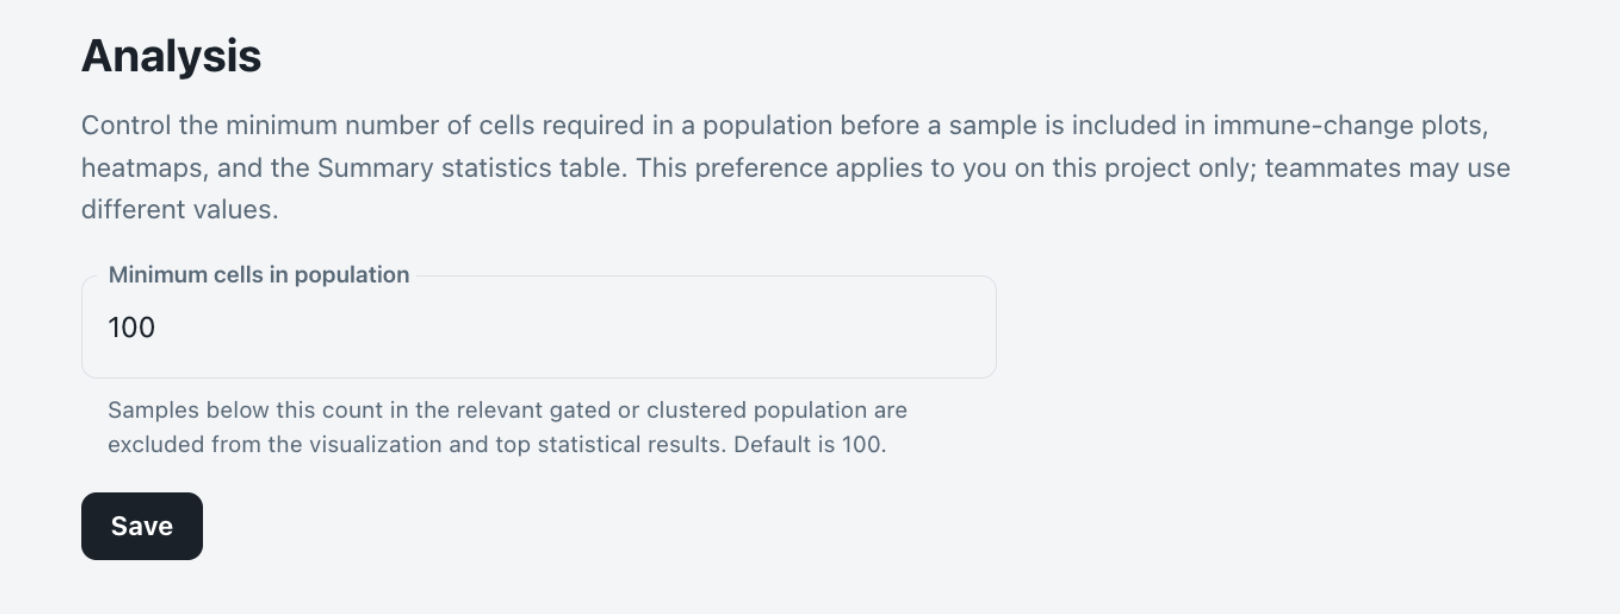
Immune Changes analyses now let you set a minimum cell count per population, so readouts built on too few cells are excluded from your plots, heatmaps, and summary statistics. The default is 100, and the threshold is yours to adjust in Settings.
What's New?
The smaller a cell population, the harder it is to know whether a frequency or marker readout reflects real biology or just the variability of the assay. That's fundamentally a question of sampling: the more cells you count in a population, the more confident you can be that the signal is real, because it's built on a larger n. Read out a population from only a handful of cells and a few events can swing the result; read it from hundreds or thousands and it stabilizes.
Immune Changes analyses now let you set a minimum cell count per population (default 100), so you decide how much sampling a population needs before it counts toward your results. There's no single correct cutoff — 10 may be plenty for one question, 1,000 the right bar for another — so the threshold is yours to set.
What Changed?
Samples below the cutoff for a given gated or clustered population are now excluded from Immune Changes plots, heatmaps, and summary statistics. On baseline-normalized views, if a subject's baseline sample falls below the cutoff for that population, the subject is removed from the normalized analysis for that population.
The same sample can still appear in other populations where its cell count is sufficient. Excluded samples and subjects are flagged for each plot, so it's always clear what was left out and why.
Why It Matter
Because confidence in a readout scales with the number of cells behind it, filtering the underpowered populations means the comparisons that remain rest on measurements you can trust. Group differences tighten, and a change is more likely to reflect real immune biology than the swing you'd expect from counting too few cells.
Availability
Live now at app.teiko.bio. The cutoff is set per user, per project, in Settings → Analysis.